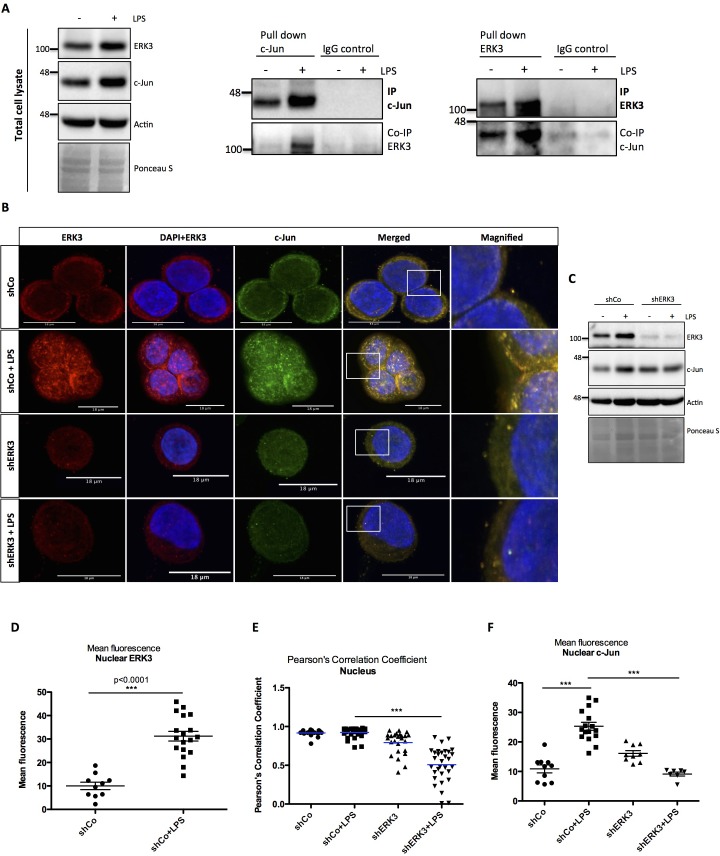
Figure 7. ERK3 interacts with c-Jun and regulates its nuclear abundance.
(A) Co-immunoprecipitation (IP) of ERK3 and c-Jun in unstimulated and LPS stimulated HT-29 cells using a c-Jun or ERK3 antibody. Levels of c-Jun and ERK3 were monitored. IgG isotype control for IP and co-IP was included. Actin and Ponceau S staining were used as loading controls for total cell lysate western blot analysis. (B) Confocal analysis of IF staining of control (shCo) and ERK3 knockdown (shERK3) HT-29 cells cultured in the presence and absence of LPS. Cells were stained with c-Jun primary antibody followed by rabbit Alexa488 (green), with ERK3 antibody followed by Cy3 mouse secondary (red) and Hoechst for the nuclei. Scale bars 18 µm. Boxed areas in merged images were magnified and are presented on the right. (C) Western blot analysis of control (shCo) and ERK3-depleted (shERK3) HT-29 cells subjected to IF staining presented in C. Levels of ERK3 and c-Jun are depicted in the control and LPS stimulated cells as well as actin loading control and Ponceau S staining. (D) ImageJ quantification of the fluorescence intensities was performed as described in the Materials and methods section. Graph represents mean red (ERK3) fluorescence intensities in control (shCo) and LPS stimulated (shCo+LPS) HT-29 cells; *p<0.05, **p<0.01, ***p<0.001, one-way ANOVA, Turkey’s post-test. (E) Pearson’s correlation coefficient values obtained from co-localization analyses as described in the Materials and methods section are presented in control (shCo) and ERK3 knockdown cells (shERK3) under -/+ LPS conditions. Scores above 0 indicate a tendency towards co-localization with a perfect co-localization with a score of 1; *p<0.05, **p<0.01, ***p<0.001, one-way ANOVA, Turkey’s post-test. (F) Mean green fluorescence intensity (c-Jun) was determined in control (shCo) and ERK3-depleted (shERK3) HT-29 cells in the presence and absence of LPS; *p<0.05, **p<0.01, ***p<0.001, one-way ANOVA, Turkey’s post-test.
Figure 7—figure supplement 1. Cell fractionation experiment performed in HT-29 cells in the presence and absence of LPS (1.5 hr).


