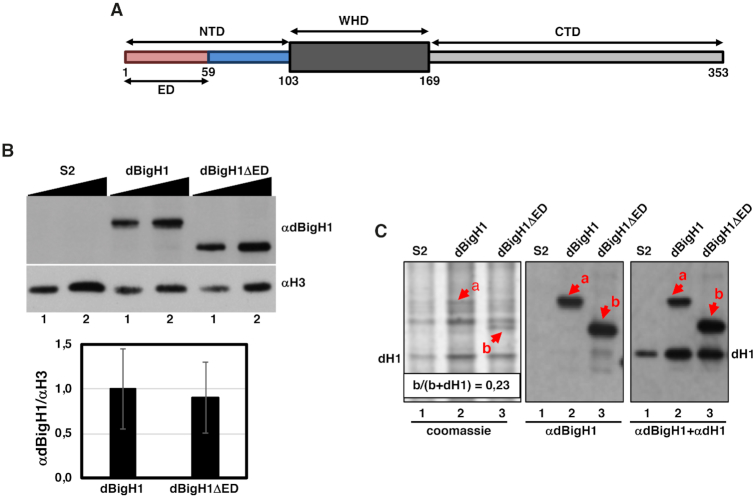
Figure 1.
Expression of dBigH1 constructs used in these experiments. (A) Schematic representation of the domain organization of dBigH1. NTD, N-terminal domain; WHD, winged helix domain; CTD, C-terminal domain; ED, acidic domain. Numbers indicate aa position in the primary sequence. (B) The abundance of the indicated dBigH1 constructs in crosslinked chromatin prepared from control S2 cells and cells expressing full-length dBigH1::FLAG and the truncated dBigH1ΔED::FLAG form was determined by WB with αdBigH1 antibodies. Increasing amounts of chromatin are analyzed (lanes 1 and 2). αH3 antibodies were used for normalization. Quantitative analysis of the results is shown in the bottom (N = 3; error bars are SD; two tailed t-test, P-value = 0.247). (C) Total acid extracts prepared from control S2 cells (lane 1) and cells expressing full-length dBigH1::FLAG (lane 2) and the truncated dBigH1ΔED::FLAG (lane 3) forms were analyzed in Coomassie-blue stained gels (left) and by WB with αdBigH1 (center) and αdBigH1+αdH1 (right) of the gel in the left. Bands corresponding to dBigH1::FLAG (a) and the truncated dBigH1ΔED::FLAG (b) forms are indicated. The band corresponding to dH1 is also indicated. Note that dBigH1::FLAG overlaps with an unrelated species present in control S2 cells. The proportion of dBigH1ΔED::FLAG (band b) respect to total linker histones (b+dH1) is indicated.

