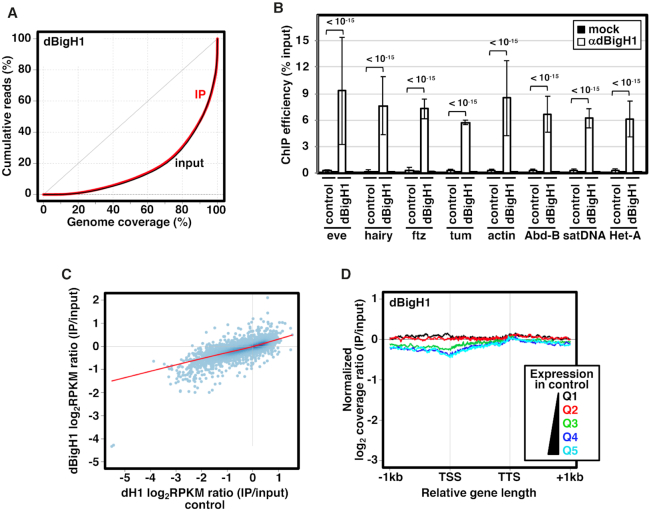
Figure 2.
Ectopic dBigH1 expression in S2 cells results in its binding across chromatin. (A) Lorenz curves showing coverage inequality for IP (red) and input samples (black) of dBigH1 ChIP-seq analyses in induced cells. (B) ChIP-qPCR analyses with αdBigH1 antibodies and preimmune serum (mock) at the indicated genomic regions in control and dBigH1-expressing cells (N = 2; error bars are SD; Mixed linear model Benjamini-Hochberg adjusted P-values are indicated). (C) Correlation of gene level dBigH1 content (log2RPKM IP/Input) in dBigH1-expressing cells and dH1 content (log2RPKM IP/Input) in control cells. (D) The normalized log2 coverage ratio IP/input of dBigH1 in dBigH1-expressing cells is presented along an idealized gene-length ± 1 kb for genes longer than 1 kb categorized according to their expression quantile in control cells (Q1-lowest to Q5-highest). TSS, transcription start site; TTS, transcription termination site.

