Figure 3.
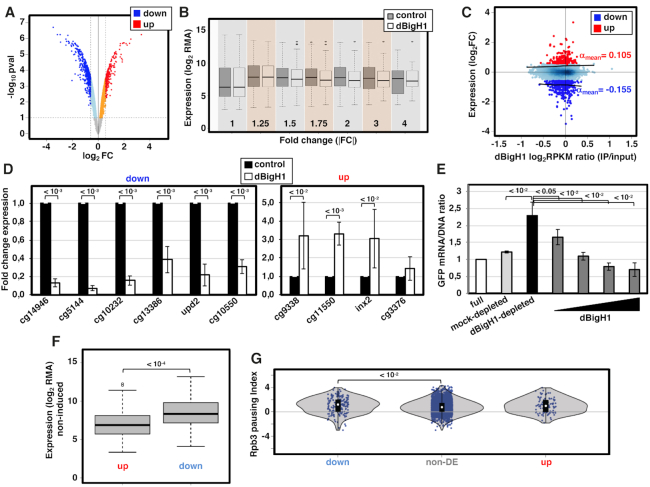
dBigH1 down-regulates gene expression. (A) Volcano plot showing the change in expression of each individual gene in cells expressing dBigH1 in comparison to control mock-induced cells. Differentially down-regulated and up-regulated genes (|FC| > 1.5; Benjamini-Hochberg adjusted P-value < 0.1) are indicated in blue and red, respectively. (B) The normalized gene expression (log2RMA) in dBigH1-expressing cells and control mock-induced cells is presented for all genes classified according to their absolute fold-change (|FC|) expression upon dBigH1 expression. (C) Correlation of gene level dBigH1 content (log2RPKM IP/input) and expression FC upon dBigH1 expression (log2FC). Genes differentially up-regulated (red) and down-regulated (blue) are indicated. Non-DE genes are also indicated (light blue). Black lines are lowess regression fits for up-regulated and down-regulated genes; the average slopes (αmean) are indicated. (D) The fold change expression with respect to control mock-induced cells of six randomly selected down-regulated genes (left) and four randomly selected up-regulated genes (right) was determined by RT-qPCR in dBigH1-expressing cells (white) (N = 7; error bars are SD; two-tailed t-test, P-values are indicated). (E) The relative GFP mRNA/DNA ratios of a chromatin template carrying a GFP-reporter gene assembled in vitro in full (white), mock-depleted (light grey) and dBigH1-depleted DREX in the absence (black) and presence of increasing amounts of bacterially-expressed dBigH1 added during assembly (dark grey) (N = 3; error bars are SD; two-tailed t-test, P-values are indicated). (F) The expression (log2RMA) in control cells is presented for up-regulated and down-regulated genes (Wilcoxon rank sum test, P-value is indicated). (G) The pausing index of total RNApol II (Rpb3) in control cells is presented for down-regulated, non-DE and up-regulated genes (Wilcoxon rank sum test, P-values are indicated).

