Figure 4.
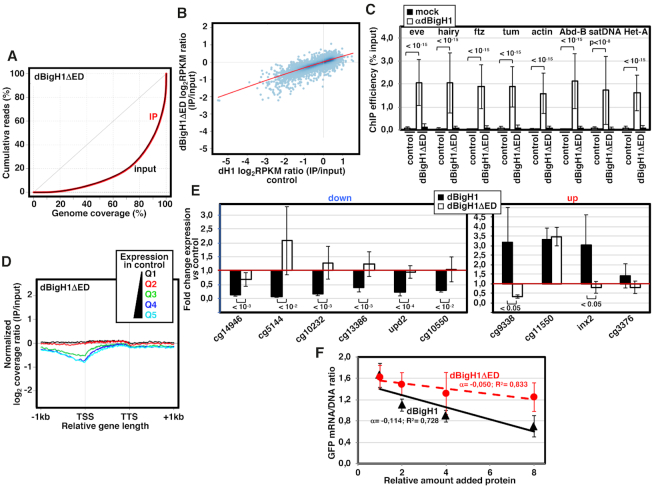
The acidic N-terminal ED-domain of dBigH1 is required for down-regulation. (A) Lorenz curves showing coverage inequality for IP (red) and input samples (black) of dBigH1ΔED ChIP-seq analyses in induced cells. (B) Correlation of gene level dBigH1ΔED content (log2RPKM IP/Input) in dBigH1ΔED-expressing cells and dH1 content (log2RPKM IP/Input) in control cells. (C) ChIP-qPCR analyses with αdBigH1 antibodies and preimmune serum (mock) at the indicated genomic regions in control and dBigH1ΔED-expressing cells (N = 2; error bars are SD; Mixed linear model Benjamini-Hochberg adjusted P-values are indicated). (D) The normalized log2 coverage ratio IP/input of dBigH1ΔED in dBigH1ΔED-expressing cells is presented along an idealized gene-length±1kb for genes longer than 1kb categorized according to their expression quantile in control cells (Q1-lowest to Q5-highest). TSS, transcription start site; TTS, transcription termination site. (E) The fold change expression with respect to control mock-induced cells of six randomly selected down-regulated genes (left) and four randomly selected up-regulated genes (right) was determined by RT-qPCR in dBigH1ΔED-expressing cells (white) and compared to dBigH1-expressing cells (black) (N≥4; error bars are SD; two-tailed t-test, P-values are indicated). (F) Inhibition curves showing the relative GFP mRNA/DNA ratio of a chromatin template carrying a GFP-reporter assembled in vitro in dBigH1-depleted DREX upon the addition of increasing amounts of bacterially-expressed dBigH1 (black) and dBigH1ΔED (red). The correlation coefficients (R2) and slopes (α) are indicated (error bars are SD; N = 3).

