Figure 5.
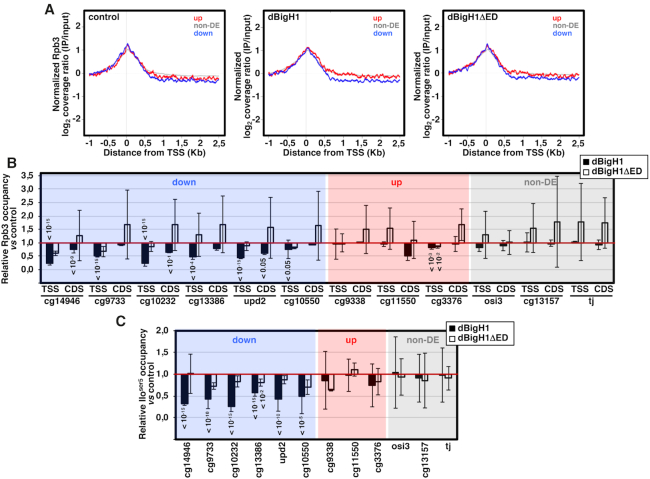
The acidic N-terminal ED-domain of dBigH1 perturbs RNApol II binding. (A) The normalized log2 coverage ratio IP/input of Rpb3 in control mock-induced cells (left), dBigH1-expressing cells (center) and dBigH1ΔED-expressing cells (right) are presented as a function of the distance to TSS for up-regulated genes (red), down-regulated genes (blue) and non-DE genes (gray). (B) The relative Rpb3 occupancy with respect to control mock-induced cells was determined by ChIP-qPCR at the indicated genomic regions in dBigH1-expressing cells (black) and dBigH1ΔED-expressing cells (white) (N = 2; error bars are SD; Mixed linear model Benjamini-Hochberg adjusted P-values with respect to mock-induced cells are indicated). (C) As in B but for the promoter-proximal RNApol IIoser5 form at TSS of the indicated genes (N = 3 (dBigH1), 2 (dBigH1ΔED); error bars are SD; Mixed linear model Benjamini–Hochberg adjusted P-values with respect to mock-induced cells are indicated).

