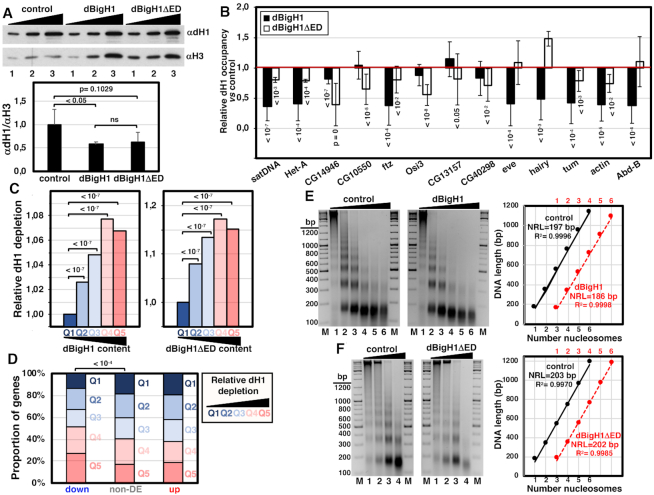
Figure 6.
dBigH1 replaces dH1. (A) WB analysis with αdH1 antibodies of crosslinked chromatin prepared from control mock-induced cells and cells expressing full-length dBigH1 and the truncated dBigH1ΔED forms. Increasing amounts of chromatin are analyzed (lanes 1–3). αH3 antibodies were used for normalization. Quantitative analysis of the results is shown in the bottom (N = 3; errors bars are SD; two tailed t-test, P-values are indicated). (B) The relative dH1 occupancy with respect to control mock-induced cells was determined by ChIP-qPCR at the indicated genomic regions in dBigH1-expressing cells (black) and dBigH1ΔED-expressing cells (white) (N = 3; error bars are SD; Mixed linear model Benjamini-Hochberg adjusted P-values with respect to mock-induced cells are indicated). (C) The average extent of dH1 depletion is presented for all genes categorized according to their dBigH1 (left) and dBigH1ΔED (right) content quantile in dBigH1-expressing and dBigH1ΔED-expressing cells (Q1-lowest to Q5-highest), normalized respect to Q1 (Wilcoxon rank-sum test, Benjamini–Hochberg adjusted P-values are indicated). (D) The proportion of genes categorized according to their relative dH1 depletion (Q1-lowest to Q5-highest) is presented for down-regulated, up-regulated and non-DE genes (Chi-square test, P-values are indicated). (E) MNase digestion for increasing time (lanes 1–6) of nuclei obtained from control mock-induced cells (left) and dBigH1-expressing cells (right). Lanes M correspond to MW markers (the sizes in bp are indicated). Quantitative analysis of the results is shown in the right where the size in bp of fragments containing increasing number of nucleosomes, from mono- to hexanucleosomes, are plotted against the number of nucleosomes for samples showing equivalent extent of digestion (lanes 2 in the left). The correlation coefficients (R2) and slopes, which correspond to the apparent NRL, are indicated. (F) As in E but for control mock-induced cells (left) and dBigH1ΔED-expressing cells (right).

