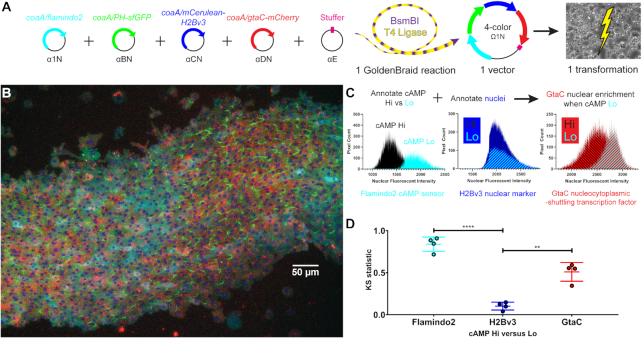
Figure 2.
Validation of GtaC nuclear translocation in response to cAMP waves: GoldenBraid cloning and generation of a D. discoideum strain that expresses four fluorescent protein fusions. (A) A single expanded α-to-Ω assembly reaction was used to generate a vector with four transcriptional units, all driven by copies of the coaA promoter. Flamindo2 is a single-channel, intracellular cyclic AMP (cAMP) sensor that fluoresces more intensely as cAMP levels decrease (Citrine, pseudocolored cyan). The pleckstrin-homology (PH) domain of CRAC localizes to the leading edge membrane of polarized cells (sfGFP, pseudocolored green). mCerulean-H2Bv3 marks nuclei (pseudocolored blue). GtaC is a transcription factor that shuttles between the nucleus and cytoplasm every ∼6 minutes in response to cAMP waves (mCherry, pseudocolored red). The single plasmid was introduced into D. discoideum by electroporation in a single transformation. (B) An under-agar image of a stream of aggregating, 4-colored D. discoideum cells demonstrates a cAMP wave. PH-sfGFP localizes to sharp, leading-edge crescents especially in areas of high cAMP (low cyan fluorescence). Nuclei are seen as blue dots. Bar = 50 μm. Images of the same field in the 4 separate channels are provided in Supplementary Figure S4. (C) Binary annotation of nuclei in areas of high versus low cAMP allows comparison of GtaC nuclear fluorescent intensities. Histograms from one representative image (764 hi-cAMP nuclei, 581 lo-cAMP nuclei) are shown. (D) Regions of interest (ROIs) in nuclei were marked using the mCerulean-H2Bv3 fusion protein in the CFP channel. We then used a binary layer based on the Flamindo2 probe in the YFP channel to annotate these ROIs as high versus low intracellular cAMP levels. We combined these binary annotations to generate ROIs of nuclei in areas of high and low cAMP levels. Finally, we quantified the GtaC-mCherry fluorescence in each ROI. We performed this analysis for two images for each of two biological replicates containing 206–1062 nuclei in each cAMP condition. Colored lines indicate mean ± SD; Brown-Forsythe ANOVA (F = 74.55) and Dunnett's T3 multiple comparisons tests of Kolmogorov–Smirnov test statistics (individual colored dots, values indicated on the Y-axis) comparing Flamindo2 to H2Bv3 (t = 15.16) and GtaC to H2Bv3 (t = 6.721); N = 4 images taken over two biological replicates; ****P ≤ 0.0001; **P = 0.0047).

