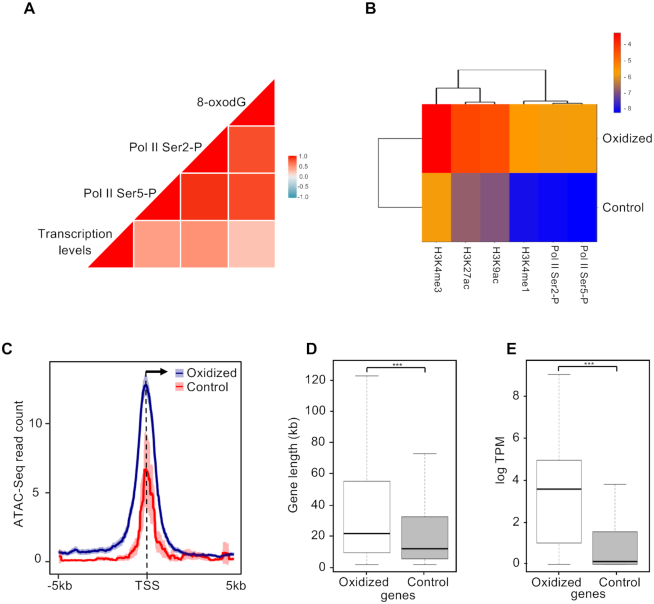
Figure 4.
(A) Correlation plot reporting Pearson correlation coefficients between transcription (GRO-seq data), 8-oxodG (Oxi-DIP-seq signal), Pol II-S5P and Pol II-S2P (ChIP-seq signals) at genes with oxidized promoters. (B) Heatmap reporting levels of H3K4me3, H3K27ac, H3K9ac, H3K4me1, Pol II-S5P and Pol II-S2P (log2 signal/Input DNA) at the oxidized and control promoters. (C) Mean-density profile of normalized ATAC-seq signal ±5 kb from the TSS of oxidized (blue) and control (red) promoters. The 95% confidence interval (2 standard error) of the mean is indicated by the light blue and light red shaded areas. The arrow indicates the direction of transcription. (D) Box plot showing the distribution of the lengths (bp) of genes with oxidized and control promoters respectively (Bonferroni adjusted pairwise t-test; ***P = 1.0e−9). (E) Box plot showing the transcription levels (GRO-seq; logTPM) distribution of genes with oxidized and control promoters (Bonferroni adjusted pairwise t-test; ***P < 2.2e–16).

