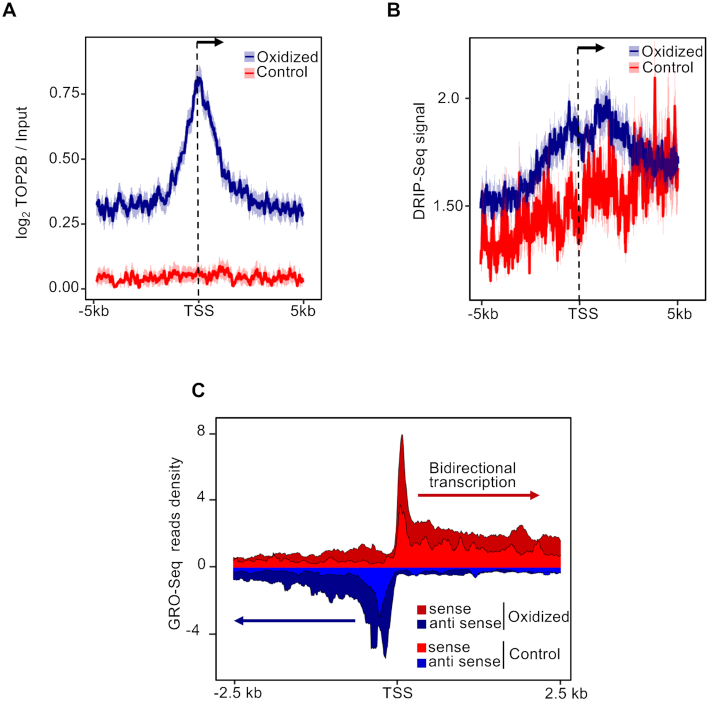
Figure 5.
(A) Mean-density profile of normalized TOPIIB signals ±5 kb from the TSS of oxidized (blue) and control (red) promoters. The 95% confidence interval (2 standard error) of the mean is indicated by the light blue and light red shaded areas. The arrow indicates the direction of transcription. (B) Mean-density profile of DRIP-seq signal ±5 kb from the TSS of oxidized (blue) and control (red) promoters. The 95% confidence interval (2 standard error) of the mean is indicated by the light blue and light red shaded areas. The arrow indicates the direction of transcription. (C) GRO-seq read density ±2.5 kb from the TSS of both sense (red) and antisense (blue) transcripts, within oxidized (dark red and dark blue) and control (light red and light blue) promoters.

