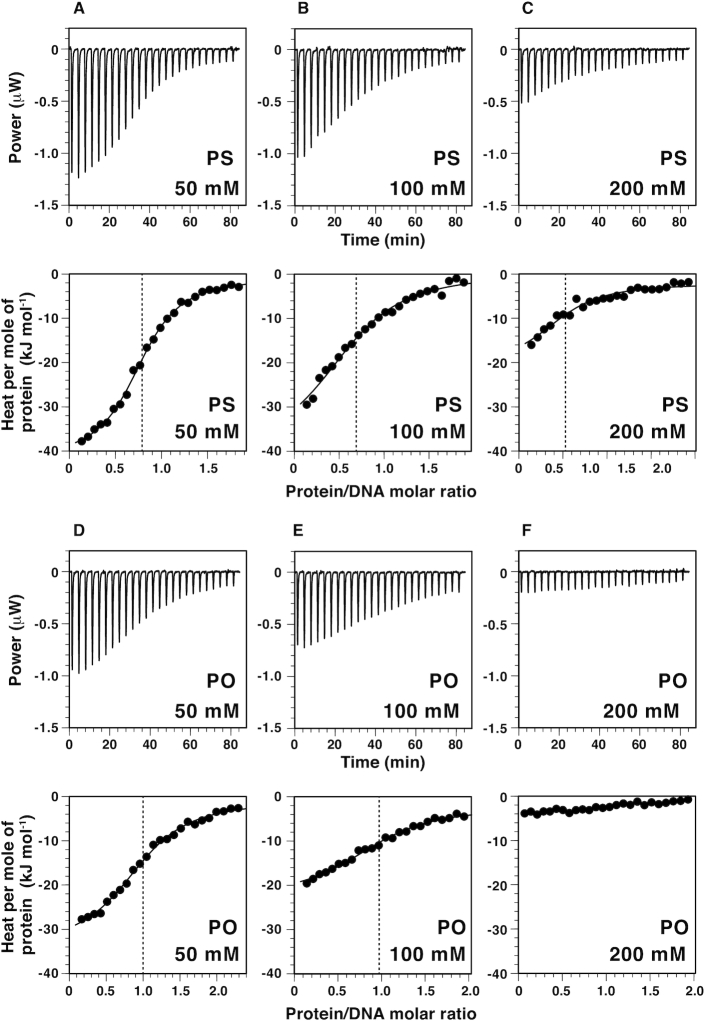
Figure 1.
ITC analyses on the interaction between SATB1-CUTr1 and DNA. Shown in the upper panels of the respective subfigures are calorimetric responses to titrations of CUTr1 to dodecamer DNAs containing a TAATA motif with phosphorothioate modifications at six protein-contacting sites (psDNA; A, B, C) or without the modifications (poDNA; D, E, F) (see Table 1). Salt concentrations are 50 mM (A, D), 100 mM (B, E) and 200 mM (C, F). In the corresponding lower panels, binding isotherms, i.e. relation between protein/DNA molar ratio and integrated heat per molar concentration of protein for the respective injections, are shown with fitting curves. Vertical broken lines show the apparent binding stoichiometry between protein and DNA.

