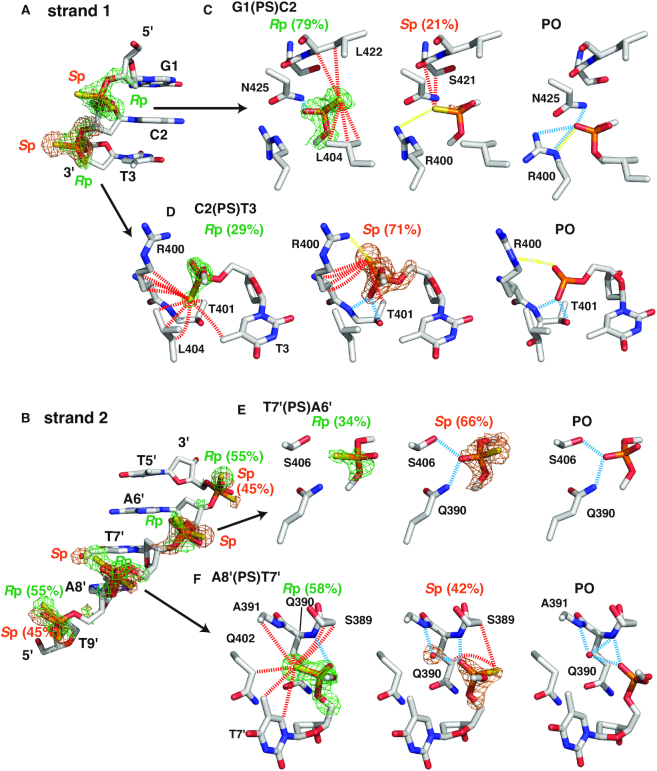
Figure 3.
Diastereomer-specific intermolecular contacts. In (A) and (B), parts of DNA strands including the six phosphorothioate-modified sites are shown, where omit maps contoured at 2.5σ of the Rp and Sp diastereomers are indicated (green and orange, respectively). A water molecule specifically observed for the Sp diastereomer at A8′(PS)T7′ is also indicated with the omit map. In (C)–(F), the two panels on the left show diastereomer-specific protein–DNA interactions in four selected sites, where dashed lines indicate hydrogen bonds with the non-bridging oxygen atoms (cyan), hydrophobic contacts with sulfur atoms (red) and salt bridges with sulfur atoms [yellow; most close pairs of (partially) charged atoms are connected], as defined in Figure 2. In the panels on the right, contacts to the equivalent phosphates in the CUTr1–poDNA complex (35) are shown. Population ratios of the diastereomers are also shown.

