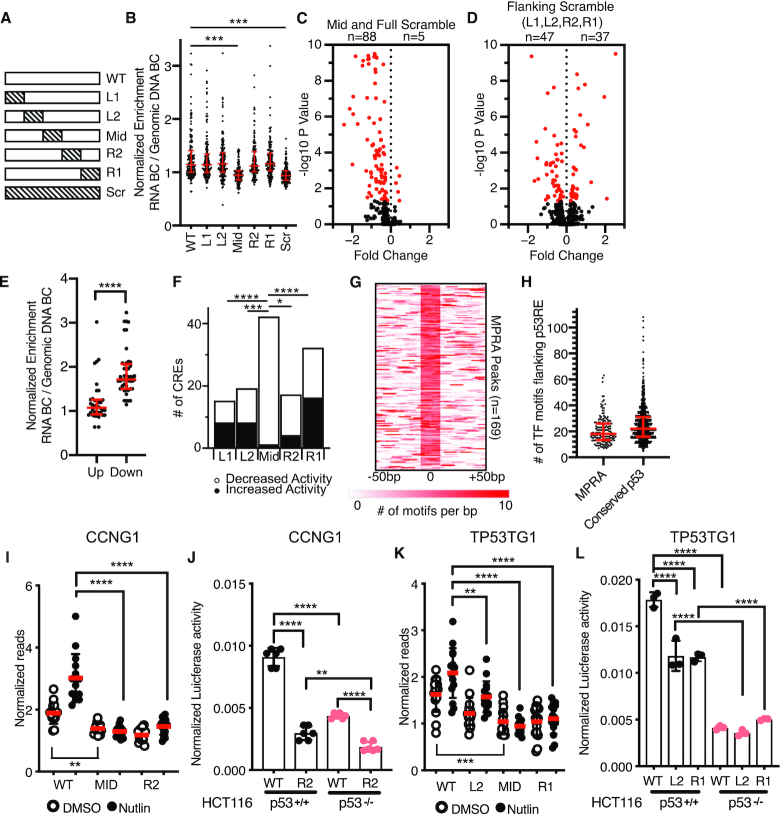
Figure 3.
(A) Schematic depicting scrambling of 20 bp sequences within 100 bp p53-bound MPRA regions. Sequence scrambling was performed to preserve total GC content within the 20 bp scrambled region relative to the wild-type sequence. (B) Normalized transcriptional activity of the MPRA sequences depicted in (A) in HCT116 p53+/+ cells after a 6-h treatment with 10 uM Nutlin-3A. Data are depicted as enrichment of the 3′UTR-encoded barcode linked to each putative regulatory region normalized to the enrichment of that same sequence integrated into the genome and represent the averages from three biological replicates of each condition. (***P < 0.001 using an ordinary one-way ANOVA). (C) Volcano plot of wild-type MPRA sequence activity compared to Mid or Full scramble. Data are plotted as Fold Change (WT over scramble) versus –log10P-value (from a one-way ANOVA with Tukey post-hoc test). (D) Volcano plot of wild-type MPRA sequence activity compared to flanking scramble (L1, L2, R2 or R1). Data are plotted as Fold Change (WT over scramble) versus –log10P-value (from a one-way ANOVA with Tukey post-hoc test). (E) Jitter plot depicting CRE activity values for wild-type p53-bound CREs (in the Nutlin-3A-treated condition) for those variants with increased (up) or decreased (down) activity relative to wild-type. P-value represents the result of an unpaired Mann–Whitney U test (****P < 0.0001). (F) Number of CRE variants per position that significantly increase or decrease in MPRA transcriptional activity compared to WT sequences (*P < 0.05, ***P < 0.001, ****P < 0.0001 by Fisher Exact Test). (G) Heatmap of transcription factor motif enrichment across 100 bp of the 169 p53-bound MPRA regions in the current study. Data represent a per base pair score for the presence of JASPAR-derived transcription factor motifs (P < 0.0001, corresponding to a JASPAR score of 400 or greater). Regions are centered on the putative p53 family response element. (G) Median values and the interquartile range are depicted in red. (H) Jitter plot representing the number of JASPAR-derived transcription factor motifs flanking the p53RE of the p53-bound CRE (P < 0.0001, corresponding to a JASPAR score of 400 or greater). Regions are centered on the putative p53 family response element (p53RE) and are extended –250 bp and +250 bp upstream. (I) Normalized transcriptional activity of the WT, Mid or R2 version of Region 36/CCNG1 from the MPRA in HCT116 p53+/+ cells after 6 h of either DMSO or 10 uM Nutlin-3A treatment. (****P < 0.0001 using an ordinary one-way ANOVA). (J) Normalized Luciferase activity of either wild-type or R2-scrambled Region 36/CCNG1 sequence cloned upstream of a minimal promoter and driving expression of firefly luciferase in either HCT116 p53+/+ or p53−/− colon carcinoma cells. Firefly luciferase values were normalized to those of Renilla luciferase driven by a CMV promoter and co-transfected with the candidate Firefly plasmid (**P < 0.01, ****P < 0.0001 using an ordinary one-way ANOVA) (K) Normalized transcriptional activity of the WT, L2, Mid or R1 version of the TP53TG1 CRE from the MPRA in HCT116 p53+/+ cells after 6 h of either DMSO or 10 uM Nutlin-3A treatment (**P < 0.01, ****P < 0.0001 using an ordinary one-way ANOVA). (L) Normalized Luciferase activity of either wild-type, L2, or R1-scrambled TP53TG1 CRE sequence cloned upstream of a minimal promoter and driving expression of firefly luciferase in either HCT116 p53+/+ or p53−/− colon carcinoma cells. Firefly luciferase values were normalized to those of Renilla luciferase driven by a CMV promoter and co-transfected with the candidate Firefly plasmid (****P < 0.0001 by one-way ANOVA).

