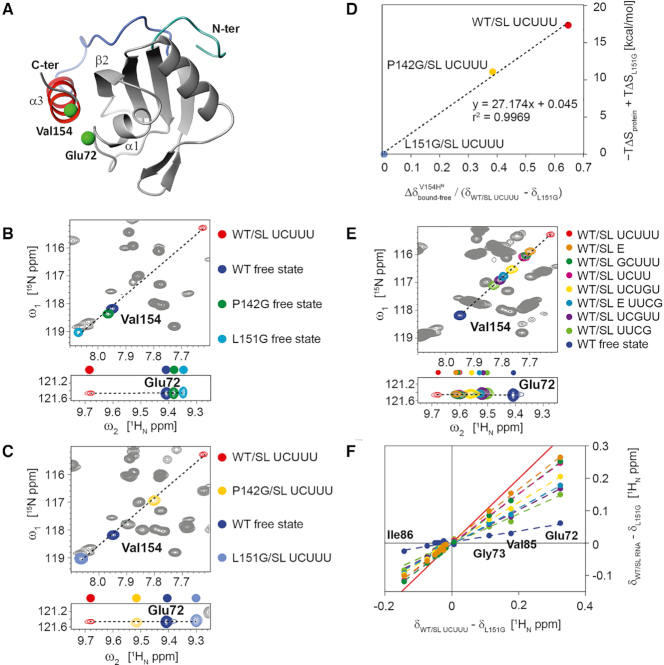
Figure 6.
(A) Val154 and Glu72, residues from α3 and α1 respectively, which are monitored in 1H–15N HSQC spectra, highlighted on WT PTB RRM1/SL UCUUU complex structure. (B, C) Superposition of 1H-15N HSQC spectra of WT PTB RRM1 in the free state with (B) spectra of WT PTB RRM1/SL UCUUU complex and mutants P142G and L151G in the free state, (C) spectra of SL UCUUU-bound states of WT PTB RRM1, P142G and L151G. (D) Correlation of the magnitude of the amide 1H shift change of Val154 upon binding SL UCUUU, for WT PTB RRM1, P142G, and L151G relative to the range spanned by PTB RRM1/UCUUU and L151G, versus the entropic contribution to binding free energy relative to L151G/SL UCUUU. (E) 1H–15N HSQC spectra of complexes of WT PTB RRM1/SL UCUUU, WT PTB RRM1/SL E RNA and complexes of WT PTB RRM1 with various RNA loop mutants of SL UCUUU. (F) The 1H amide chemical shift difference between WT PTB RRM1/SL UCUUU complex and L151G mutant for residues 72–86 (α1–β2 segment) plotted versus shift difference between WT PTB RRM1, or its complexes with SL RNA mutants, and L151G. A similar analysis was performed with 15N chemical shifts and is shown in Supplementary Figure S10. The color code is the same as that employed to represent different samples in the 1H–15N HSQC spectra in (E). Fitting parameters for the linear least squares fitting in (E) and Supplementary Figure S10 are given in Supplementary Table S2. The red line represents a slope of 1 and corresponds to the maximum effect of α3-RRM docking observed for the WT PTB RRM1/SL UCUUU complex.

