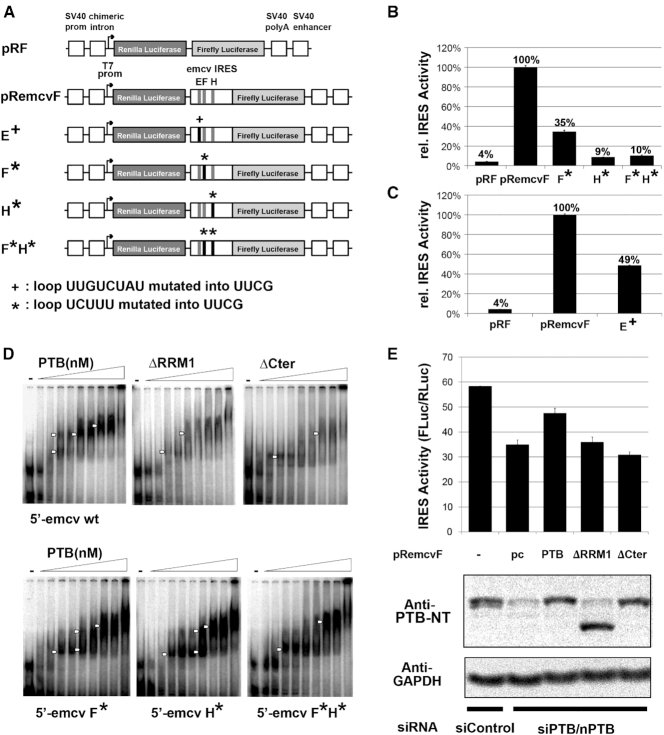
Figure 7.
(A) Schematic diagram of the reporter construct pRF, the emcv IRES-containing construct pRemcvF, and the same construct with a single mutated loop E+, F*, H* or two mutated loops F*H*. These constructs were transfected into HEK293T cells. (B) IRES activity of wild type emcv and emcv IRESs with mutations of SL F, H or both F and H. Bars represent the average of two replicates ± s.d. of the IRES activity calculated as a ratio between Firefly and Renilla luciferase normalized to IRES activity of pRemcvF. (C) IRES activity for wt emcv compared to emcv with mutated SL E. Bars represent average values of biological duplicates, each as technical triplicate. (D) Upper panel: EMSA was performed using radiolabeled wild type 5′-emcv and variable concentration of wild type or mutant his-tagged PTB1. Lower panel: EMSA with radiolabeled F*, H* or F*H* mutant 5′-emcv and variable concentration of wild type his-tagged PTB1. In all EMSAs concentration of PTB1 ranged from 0, 125, 250, 375, 500, 750, 1000, 1500, 2000 and 4000 nM and complex formation is marked with white arrows. (E) IRES activity of wild type and mutated PTB1. Top panel: pRemcvF was transfected into HEK293T cells together with only control siRNA, or with siRNA against PTB/nPTB and either empty plasmid (pc) or plasmid expressing wild type or mutant PTB1. IRES is normalized to the IRES activity measured for pRF. Bottom panel: Equivalent amount of lysates from transfected cells was analyzed by immunoblot probed with anti-PTB-NT or anti GAPDH (loading control). This showed knockdown of endogenous PTB1 using siPTB/nPTB and similar expression levels for ectopic wild type and mutant PTB1.

