Figure 3.

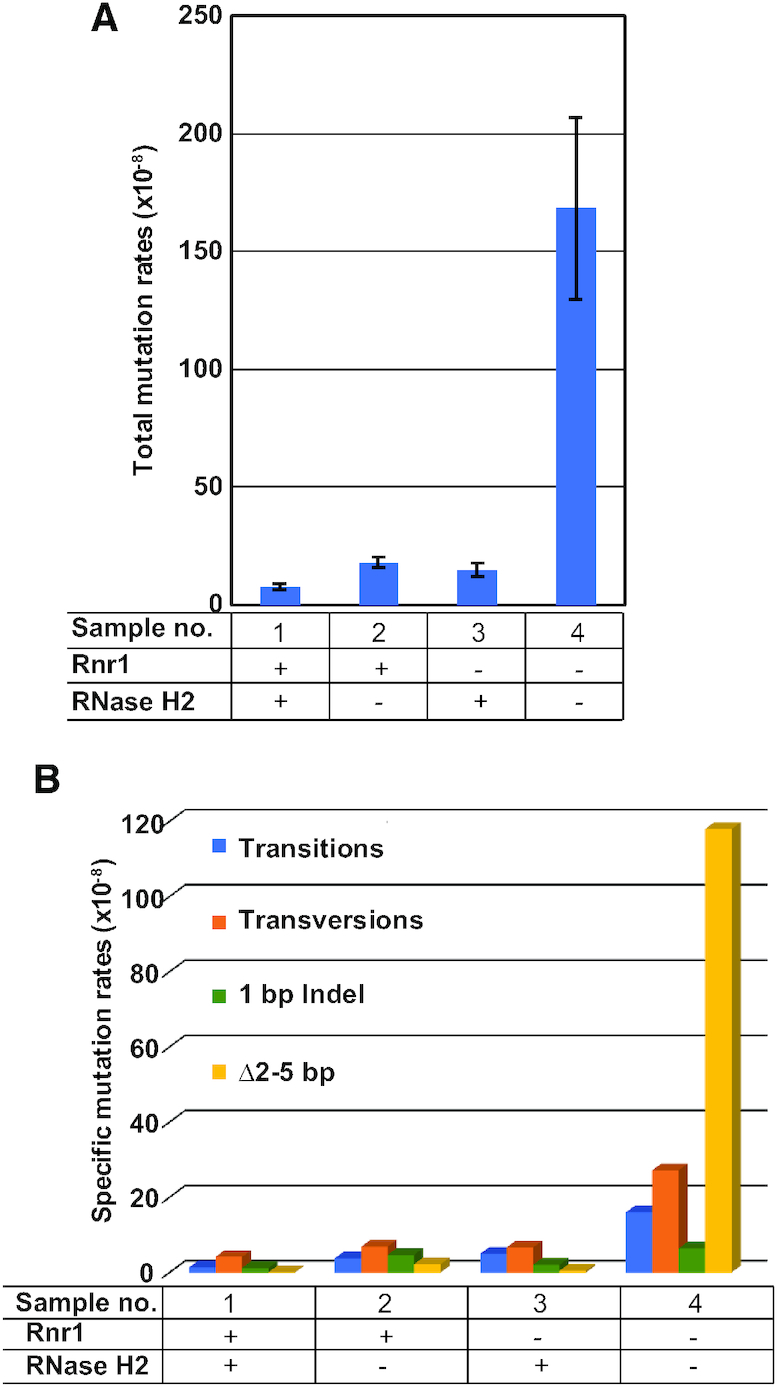
Total and Δ2–5 bp mutation rates of CAN1 are highly increased in RER-deficient Rnr1-depleted double mutant. (A) Total mutation rate is highly increased in cells lacking RNase H2 and depleted of Rnr1. WT strain (sample 1), single mutant rnh201Δ (sample 2), single mutant PGAL:3HA-RNR1 (sample 3), and double mutant PGAL:3HA-RNR1 rnh201Δ (sample 4), were grown in rich YEPD (2% glucose) solid medium. In these growth conditions, Rnr1 should be expressed at WT levels in samples 1 and 2, and Rnr1 should be depleted in samples 3 and 4. Total mutation rates are plotted on the Y-axis. The graph represents the average and S.E.M. of 4 independent experiments. See also Supplementary Table S3. Symbols on the organigram below the plot: + and – indicate that the protein is present or absent, respectively. (B) Δ2–5 bp specific mutation rate is highly increased in cells lacking RNase H2 and depleted of Rnr1. Specific mutation rates of CAN1 (mutation-spectra) for the same strains and growth conditions as in (A). Specific mutation rates are plotted on the Y-axis. The different types of mutations are color-coded. ‘1 bp Indel’ stands for 1 base pair insertion/deletion. ‘Δ2–5 bp’ stands for 2–5 base pairs deletion. See also Supplementary Table S3. For other details see (A).
