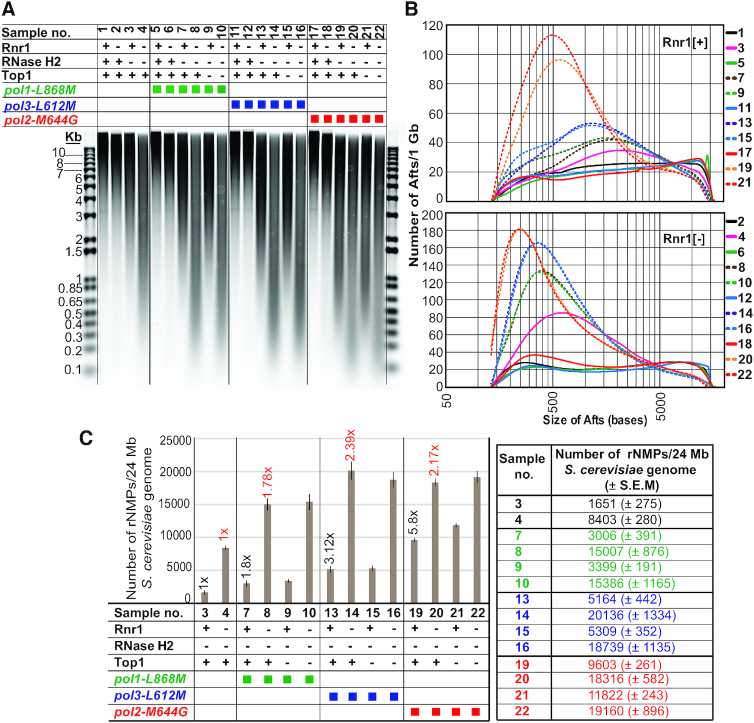
Figure 5.
Determination of the numbers of genomic rNMPs by alkali-fragmentation of ribonucleotide-containing total DNA. (A) Resolution by gel electrophoresis of alkali-fragments from total DNA (Afts). The following strains (see Supplementary Table S1 for the list of strains) are represented by symbols on the organigram. Rnr1 [+] condition (Rnr1 indicated by ‘+’ on organigram): 1. WT. 3. rnh201Δ. 5. pol1-L868M. 7. pol1-L868M rnh201Δ. 9. pol1-L868M rnh201Δtop1Δ. 11. pol3-L621M. 13. pol3-L621M rnh201Δ. 15. pol3-L621M rnh201Δtop1Δ. 17. pol2-M644G. 19. pol2-M644G rnh201Δ. 21. pol2-M644G rnh201Δtop1Δ. Rnr1 [−] condition (Rnr1 indicated by ‘−’ on organigram): 2. PGAL:3HA-RNR1. 4. PGAL:3HA-RNR1 rnh201Δ. 6. PGAL:3HA-RNR1 pol1-L868M. 8. PGAL:3HA-RNR1 pol1-L868M rnh201Δ. 10. PGAL:3HA-RNR1 pol1-L868M rnh201Δ top1Δ. 12. PGAL:3HA-RNR1 pol3-L621M. 14. PGAL:3HA-RNR1 pol3-L621M rnh201Δ. 16. PGAL:3HA-RNR1 pol3-L621M rnh201Δtop1Δ. 18. PGAL:3HA-RNR1 pol2-M644G. 20. PGAL:3HA-RNR1 pol2-M644G rnh201Δ. 22. PGAL:3HA-RNR1 pol2-M644G rnh201Δ top1Δ. For Rnr1 [+] condition (Rnr1 expression at WT levels), strains carrying the gene RNR1 under the control of its native promoter were cultured in rich YEPD (2% glucose) medium at 30°C and harvested in exponential phase at OD600 ∼0.5–0.6. For Rnr1 [−] condition (Rnr1 depletion), strains carrying PGAL:3HA-RNR1 were cultured at 30°C in liquid minimal medium lacking histidine with 2% galactose and 2% sucrose. Cells at OD600 ∼0.2 were transferred to liquid minimal medium lacking histidine with 2% glucose, maintained in exponential phase, and harvested 6 h after transfer to glucose-containing medium (see also Material and Methods). Alkali-treated DNA samples (∼2 μg per lane) together with the DNA ladder (in duplicate) were resolved on an alkaline 1% agarose gel. The gel was neutralized and stained with SYBR gold (see also Materials and Methods). Selected molecular weights of the left-hand DNA ladder are labeled in kb. The vertical lines along the image of the gel are included for clarity. Symbols on the organigram: + and – indicate that the protein is present or absent, respectively; green, blue and red squares depict the alleles pol1-L868M, pol3-L612M and pol2-M644G, respectively. (B) Distribution of Afts sizes. Densitometry of SYBR-stain signal from samples in (A) was measured at 0.01 mm intervals and the values were normalized to the length of the DNA fragment (for mathematical modeling of the data see the section ‘Quantitation of genomic ribonucleotides’ in Materials and Methods). The number of Afts of a given size per 1Gb of total DNA is plotted on the Y-axis. Sizes of Afts in bases are plotted on the X-axis. 50, 500 and 5000 bases are indicated on the X-axis of the lower-plot. Units on the Y-axis (per 1 Gb) were chosen arbitrarily. Because the yeast haploid genome size is 24 Mb, the expected number of Afts of a given size in a single yeast genome is approximately 1/42 of the numbers shown on the Y-axis. Note also the logarithmic scale of the X-axis. For the ease of comparison, histograms for conditions Rnr1 [+] and Rnr1 [−] are represented separately in the upper- and lower-plots, respectively. See also Supplementary Figure S4 for averaged data from 4 independent repeats with S.E.M. (C) Numbers of total genomic rNMPs. Total genomic rNMPs present in the 24 Mb haploid yeast genome of selected samples from (A) are plotted on the Y-axis. Shown are averaged data for four independent repeats with S.E.M. For the ease of comparison, averaged data of total genomic rNMPs are also indicated on the small table to the right-hand of the bar plot. The fold differences of samples 7, 13 and 19 relative to sample 3 are indicated above the bars on the plot by black numbers, and the fold differences of samples 8, 14 and 20 relative to sample 4 are indicated above the bars on the plot by red numbers (for P-values, see Supplementary Table S5). Symbols on the organigram (below the bar plot) are as described in (A). For the calculation of the total numbers of DNA breaks by mathematical modeling, see section ‘Quantitation of genomic ribonucleotides’ in Material and Methods (numbers of DNA breaks from four independent experiments are represented in Supplementary Table S5). For the calculations of total numbers of genomic rNMPs (see Supplementary Table S5), in order to account for DNA breaks that may occur during alkaline heat-treatment independently of incorporated ribonucleotides, the number of DNA breaks in the WT strain (sample 1, not represented on the plot and small table) was subtracted from every other Rnr1 [+] strain (samples 3, 7, 9, 13, 15, 19 and 21), and the number of DNA breaks in the single mutant PGAL:3HA-RNR1 depleted of Rnr1 (sample 2, not represented on the plot and small table) was subtracted from every other Rnr1 [−] strain (samples 4, 8, 10, 14, 16, 20 and 22).

