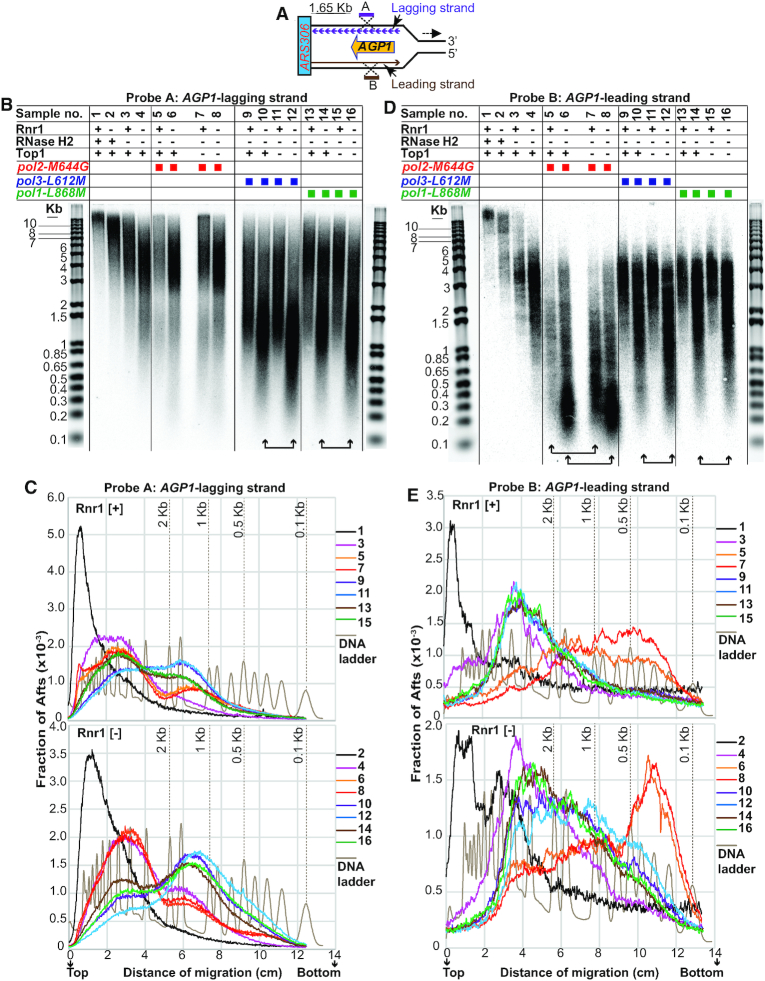
Figure 6.
Southern analyses showing that Top1 cleaves genomic ribonucleotides in Rnr1-depleted RER-deficient triple mutants bearing Pol ϵ-M644G, δ-L612M or α-L868M. (A) Scheme depicting the RF encompassing the locus AGP1, which is located at ∼1.65 Kb distance from the right side of the bidirectional origin ARS306 on chromosome III (the direction of replication, left to right, is indicated by a black horizontal arrow). For clarity, the RF to the left side of ARS306 is omitted. OFs in the nascent lagging strand, which are synthesized by Pols α and δ, are depicted by small purple arrows. The nascent leading strand, which is mainly synthesized by Pol ϵ, is depicted by a long brown arrow. Template lagging and leading strands are depicted by black lines. Single-stranded probes A and B (length ∼660 nt) hybridize to AGP1-lagging strand DNA (bottom strand) and AGP1-leading strand DNA (top strand), respectively, at ∼2 Kb distance from the right side of ARS306 (for primer sequences see Supplementary Table S2). (B–E) The following strains (see Supplementary Table S1 for the list of strains) are represented by symbols on the organigrams in (B) and (D). Rnr1 [+] condition: 1. WT; 3. rnh201Δ; 5. pol2-M644G rnh201Δ; 7. pol2-M644G rnh201Δ top1Δ; 9. pol3-L621M rnh201Δ; 11. pol3-L621M rnh201Δtop1Δ; 13. pol1-L868M rnh201Δ; 15. pol1-L868M rnh201Δ top1Δ. Rnr1 [−] condition: 2. PGAL:3HA-RNR1; 4. PGAL:3HA-RNR1 rnh201Δ; 6. PGAL:3HA-RNR1 pol2-M644G rnh201Δ; 8. PGAL:3HA-RNR1 pol2-M644G rnh201Δtop1Δ; 10. PGAL:3HA-RNR1 pol3-L621M rnh201Δ; 12. PGAL:3HA-RNR1 pol3-L621M rnh201Δ top1Δ; 14. PGAL:3HA-RNR1 pol1-L868M rnh201Δ; 16. PGAL:3HA-RNR1 pol1-L868M rnh201Δ top1Δ. For the description of Rnr1 [+] and Rnr1 [−] conditions and symbols on the organigrams see legend of Figure 5A. Alkali-treated DNA samples were separated on two alkaline 1% agarose gels (5 μg DNA per lane and per gel). The gels were neutralized, stained with SYBR gold (see pictures in Supplementary Figure S7) and capillary-blotted. Each membrane was hybridized with one radiolabeled probe (see also Material and Methods). Represented is an example of two independent repeats. (B) Blot showing Southern hybridization of AGP1-lagging strand DNA with probe A. For the ease of comparison, SYBR-stained DNA ladders from the picture of the gel represented in Supplementary Figure S7A were superimposed on the image of the blot. Selected molecular weights are labeled in kb on the left-hand ladder. Double-arrowed horizontal bars on the bottom of the blot point towards prominent differences between Top1+ and Top1– strains. The vertical lines along the image of the blot are included for clarity. (C) Signal densitometry histograms of samples in (B). Densitometry of radioactive signal was measured at 0.01 mm intervals and the background subtracted within each lane. To account for differences in loading between DNA samples, the densitometry of each interval was normalized to the sum of densitometries of all intervals within each lane. Normalized values are plotted on the Y-axis as a fraction of Afts. Distances of migration of Afts on the gel are plotted on the X-axis. For the ease of comparison, histograms for Rnr1 [+] and Rnr1 [−] conditions are represented separately in the upper- and lower-plot, respectively. The densitometry histogram of the DNA ladder is superimposed on each plot. Selected DNA molecular weights are labeled in Kb. The distance (in cm) and direction (top to bottom) of migration of Afts are indicated below the X-axis of the lower-plot. (D) Blot showing Southern hybridization of AGP1-leading strand DNA with probe B. SYBR-stained DNA ladders from the picture of the gel in Supplementary Figure S7B were superimposed on the image of the blot. For other details, see (B). (E) Signal densitometry histograms of samples in (D). For other details, see (C).

