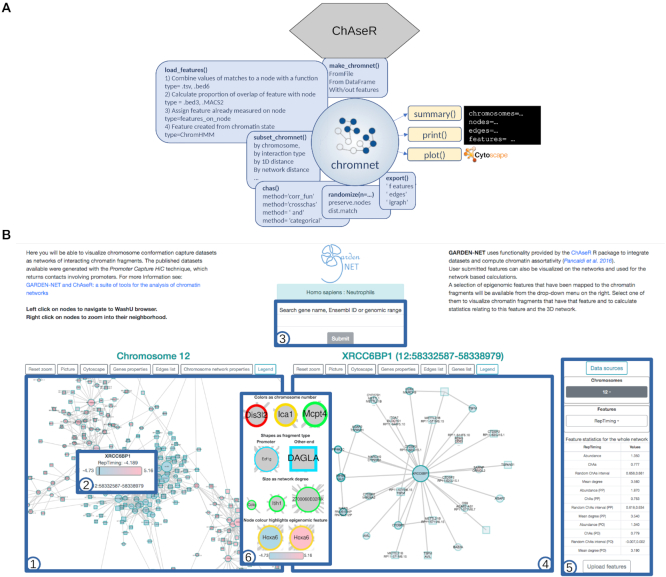
Figure 1.
Schematic overview of the two tools presented to perform chromatin network analysis. (A) Schematic view of the functionalities of the ChAseR R package. (B) A screen shot of the GARDEN-NET web-tool showing the main components: 1) the viewer on the left shows the network for the selected species and cell type; 2) the tool-tip shows properties of the node; 3) the search box allows to search for genes or genomic regions; 4) the viewer on the right shows the searched region or neighbours of selected genes; 5) the menu on the right allows for choosing chromosome (including the option PP to visualize the entire PP network for PCHi-C networks), selecting features to be displayed, and uploading user-defined features. The table under the menu displays calculated correlations and network properties of nodes with the selected feature. The legend at the center that can be opened from the option on the left-viewer shows the mapping between features and visual properties.

