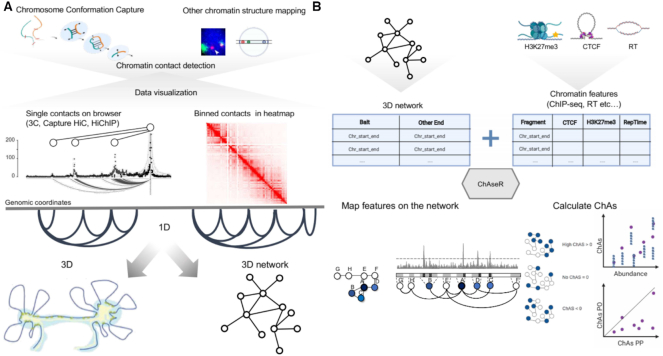
Figure 2.
Schematic representation of the chromatin assortativity approach to study genome organization. (A) Schema representing the different chromatin contact detection methods and different representations of these datasets. (B) Schema representing the different components that should be used as input in ChAseR and chromatin assortativity calculations and the two main ChAseR outputs: chromatin networks annotated with features and ChAs calculated on them. Mapping features on the networks involves assigning a value corresponding to a feature on the represented genomic fragment to each chromatin network node. Chromatin assortativity estimates whether there are preferential contacts connecting chromatin fragments that have a specific feature (blue nodes in the schematic). The ChAs calculation can be used to represent two types of plots: a ChAs versus abundance plot or, for networks that can be subdivided into PO and PP subnetworks, a plot showing ChAs in the PO vs PP subnetworks. These two plots suggest respectively whether the ChAs of the feature of interest (purple circle) is high compared to random expectation (blue smaller circles, see Materials and Methods) and whether it is most important for PP or PO contacts.

