Figure 3.
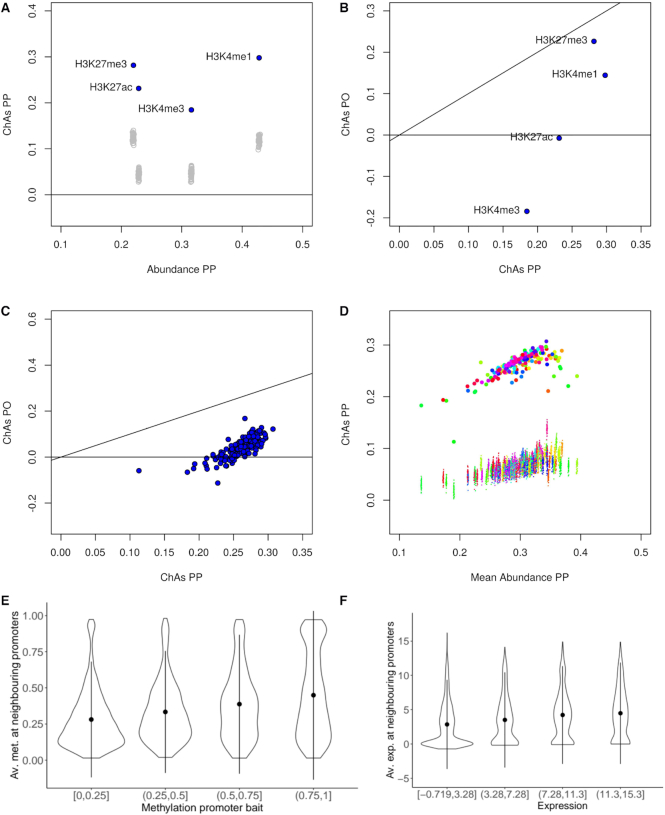
Analysis of the assortativity of epigenomic features in primary neutrophils. (A) ChAs vs abundance on PCHi-C PP networks for 4 different histone modifications in a single individual of the EPIVAR project (32). Empty grey circles represent ChAs calculated on distance-preserving randomizations. (B) ChAs calculated for the same features as (A) in the PO and PP PCHi-C networks. The black line shows the diagonal (x = y). (C) ChAs for H3K27ac in the PO and PP PCHi-C networks for 150 different healthy individuals from EPIVAR. The black line shows the diagonal (x = y). (D) ChAs vs abundance for H3K27ac across all individuals from the same dataset as (C). Small dots correspond to ChAs values obtained for distance-preserving randomized networks and colours identify individuals. (E) Correlation between methylation quartiles at promoter baits and average methylation at neighbouring promoters in the PCHi-C PP neutrophil network. (F) Correlation between expression quantiles at promoter baits and average expression at neighbouring promoters in the PCHi-C PP neutrophil network.

