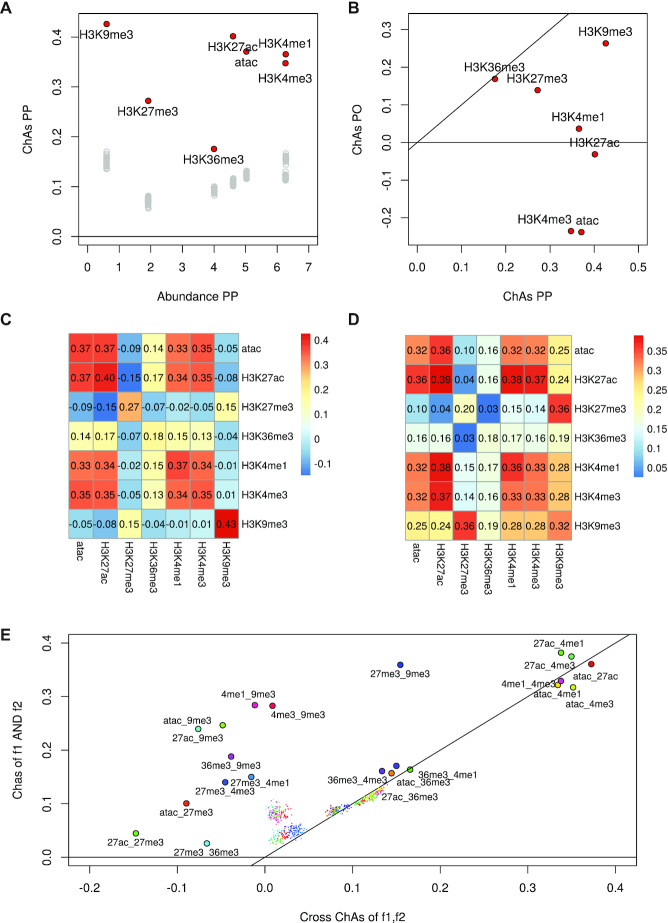
Figure 4.
Analysis of assortativity of six histone modifications and DNA accessibility (33) on the PCHi-C network for B cells. (A) ChAs versus Abundance calculated on the PCHi-C PP subnetwork for B cells (red circles) and values obtained by distance-preserving randomizations (grey circles). (B) ChAs in PO vs PP network for dataset in (A). (C) cross-ChAs of all possible feature combinations on the PCHi-C PP B cells network (the diagonal values correspond to single-feature ChAs). (D) AND-ChAs of all possible feature combinations on the PCHi-C PP B cells network. (E) Comparison between values of AND-ChAs and cross-ChAs. The insets show schematic representations of the two possible combined ChAs scenarios in the case of TF binding or histone modfications. cross-ChAs detects the presence of preferential contacts between regions with feature 1 and other regions with feature 2. AND-ChAs detects preferential contacts involving regions presenting both feature 1 and feature 2. Smaller coloured dots represent corresponding combined ChAs expected values according to distance preserving randomizations. All histone modifications are on histone 3 lysins (H3K removed for clarity from datapoint names).

