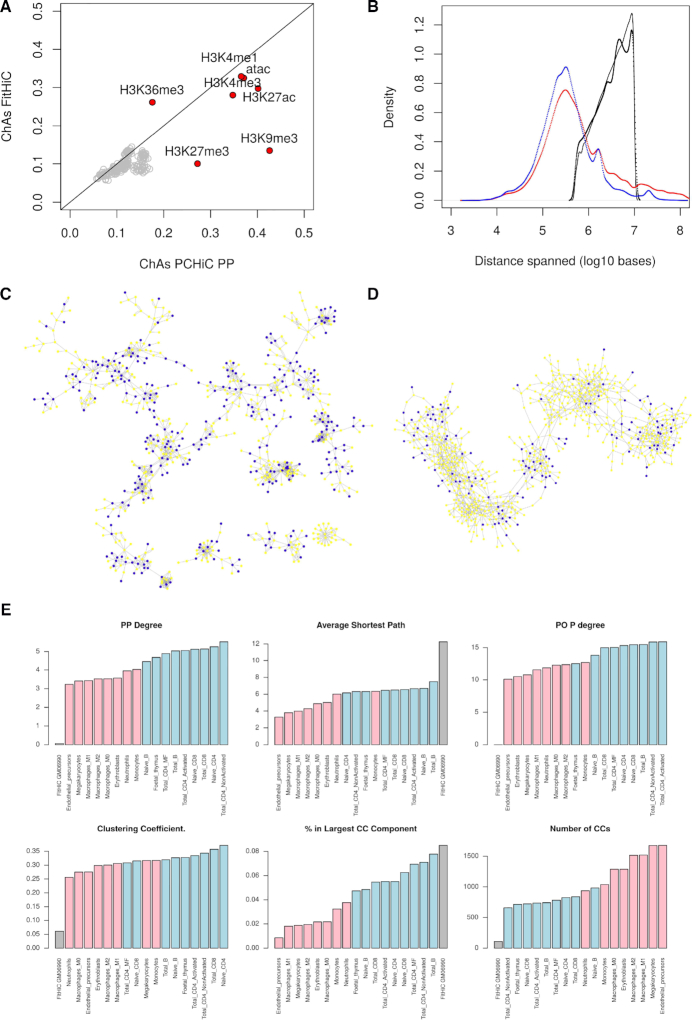
Figure 5.
Comparison of PCHi-C and Hi-C networks. (A) Comparison of ChAs values calculated for histone modifications on the Hi-C network compared to the PCHi-C PP subnetwork. Grey dots indicate distance preserving randomizations. (B) Distribution of distances spanned by different networks. PCHi-C PP networks for neutrophils (blue) and B cells (red), GM06990 Hi-C network with FitHiC P-value < 0.05 (black), GM06990 Hi-C network with all contacts identified by FitHiC (grey). (C) A portion of the PCHi-C PP subnetwork for neutrophils. Expression is denoted by node color (yellow RPKM < 1, blue RPKM > 1, (32)). (D) A portion chromosome 1 on the Hi-C network for GM06690 (35) showing contacts with FitHiC P-value < 0.05. Expression is denoted by node color (yellow RPKM < 1, blue RPKM > 1 (34)). (E) Topological network properties of haematopoietic networks. PO P degree = degree of promoter nodes in the PO subnetwork. CC = connected component.

