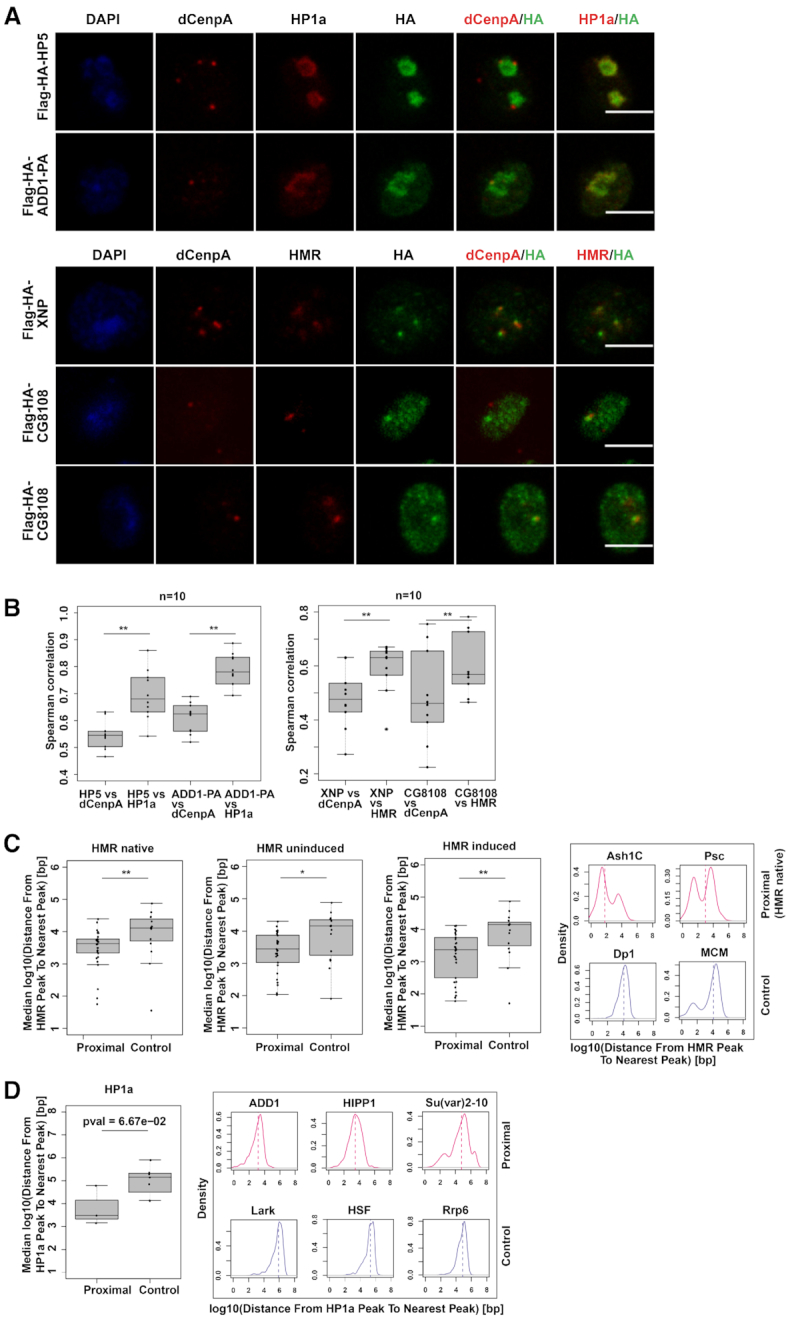
Figure 4.

(A) dCenpA, HP1a/HMR and HA tag stainings (single stacks shown) of stable cell lines expressing Flag-HA- HP5, ADD1-PA, XNP and CG8108. Anti-HP1a mouse C1A9, anti-HMR rat 2C10, rabbit anti-dCenpA and anti-HA rat R001 antibodies were used. For XNP colocalization with HMR is observed in all cells, for CG8108 – in approx. 15–30% of cells with moderate protein overexpression (quantification done from single stacks). (B) Distributions of Spearman correlations of staining pairs. Wilcoxon signed-rank test was used for comparisons. For the second staining dCenpA and HA channels were recorded in parallel, HMR channel - separately. Images of 10 cells from 2–3 independent experiments were used. (C). (D) Distributions of median distances from the HMR/HP1a ChIP-seq peak to nearest protein ChIP-seq peak of HMR/HP1a proximal/anti-proximal (control) proteins. HMR native (36) and ectopically expressed HMR (uninduced, (68)), as well as HP1a (36) profiles are used for comparison. For HP1aAP enriched proteins found in two out of three time points are taken, for anti-enriched proteins – found in 2 out of 3 time points, with anti-enrichment cutoff of –0.3. Examples of distributions of the distances from the native HMR/HP1a peak to the nearest protein peak are given on the right. List of GSEs of ChIP-sequencing profiles used is available at Supplementary Table S6. Wilcoxon rank sum test is used for statistical analysis. *P-value < 0.05, **P-value < 0.01.
