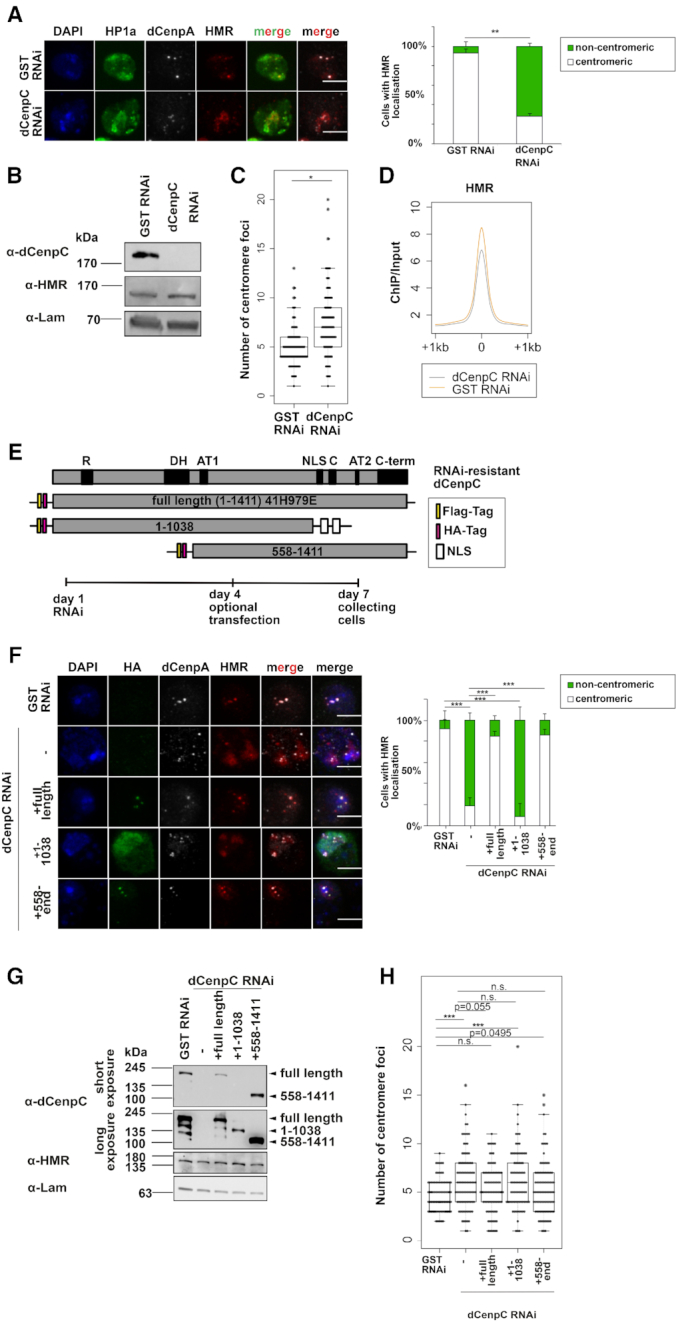
Figure 6.

(A) Left panel: Immunofluorescent stainings (maximum intensity projections shown) against HP1a, HMR and dCenpA upon GST and dCenpC knockdowns. Scale bars represent 5 μm. Antibodies used for staining were anti-HMR 2C10, anti-HP1a C1A9 and rabbit anti-dCenpA. Right panel: Quantification of centromeric and heterochromatic localization of HMR. Unpaired T-test on fractions of cells with centromeric HMR localization was used for statistical analysis. Error bars represent standard deviation. (B) Western blots of GST RNAi and dCenpC RNAi whole cell extracts indicating dCenpC knockdown and unchanged HMR levels. Lamin was used as a loading control. (C) Distributions of centromere foci number upon GST and dCenpC RNAi. P-values were calculated by fitting a generalized mixed effect model on condition as fixed effect and independent experiments as random effect. (D) Composite plot of HMR ChIP-sequencing signal centered at HMR peaks upon GST and dCenpC RNAi. (E) Domains’ scheme of dCenpC and RNAi-resistant constructs used in rescue experiments, as well as the scheme of rescue experiment. R - arginine-rich region, DH—a highly conserved region in the dCenpC homologs; AT1/2—predicted AT hooks; C—the dCenpC motif; C-term—the metazoan-like C-terminal region; NLS—nuclear localization signal (101). (F) Immunofluorescent stainings (maximum intensity projections shown) against HA tag, HMR and dCenpA upon GST and dCenpC RNAi. Scale bars represent 5 μm. Antibodies used for staining were anti-HA mouse 12CA5, anti-HP1a C1A9 and rabbit anti-dCenpA. Right panel: Quantification of centromeric and non-centromeric localization of HMR. Linear model on fractions of cells with centromeric HMR localization was used for statistical analysis. Error bars represent standard deviation. (G) Western blot indicating dCenpC RNAi and expression of RNAi-resistant dCenpC proteins upon transient transfection, as well as HMR levels in all conditions. Lamin was used as a loading control. (H) Distributions of centromere foci number upon GST RNAi, dCenpC RNAi and dCenpC RNAi + transient transfection of RNAi-resistant dCenpC proteins. P-values were calculated as in (C). N.S., non-significant; *P-value < 0.05, **P-value < 0.01, ***P-value < 0.001.
