
Figure 1:
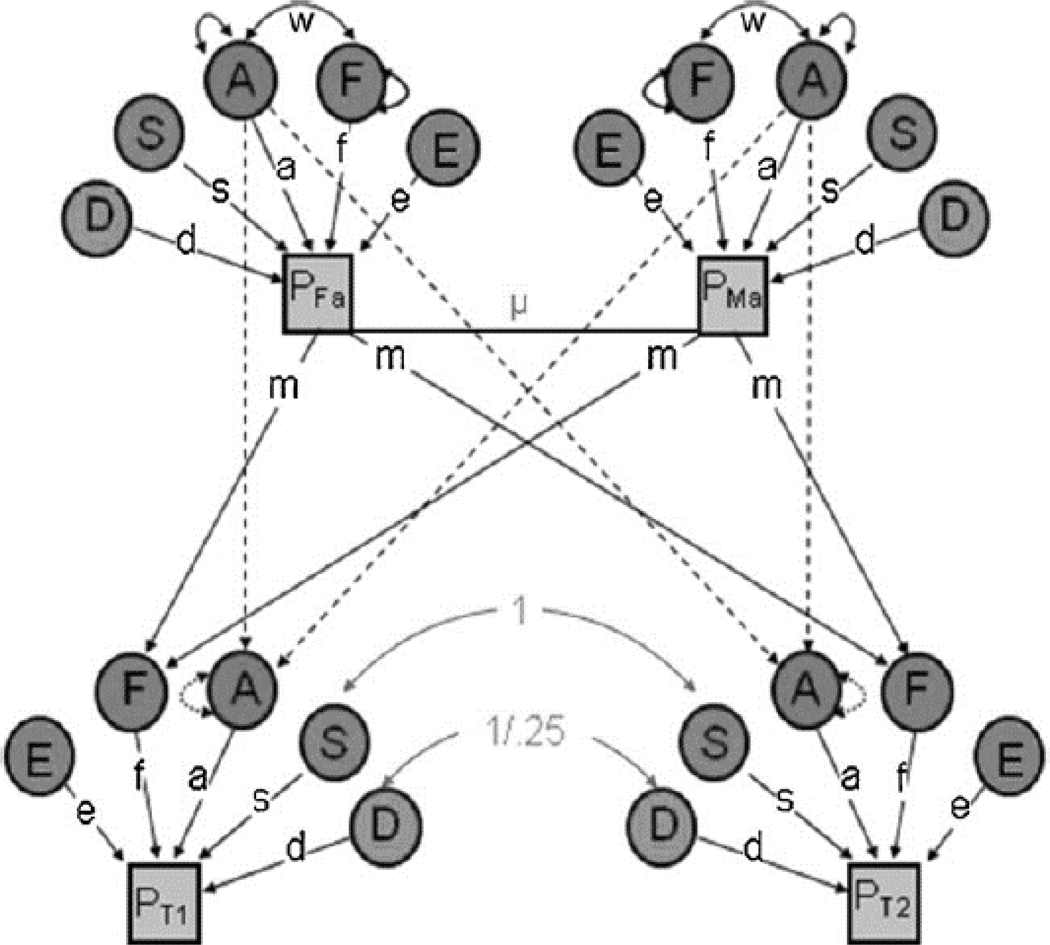
Path diagram of a Univariate Nuclear Twin Family model
Note: The variance in the phenotype (P) is parsed into that which is due to additive genetic effects (A), dominant genetic effects (D), sibling environmental influences (S), familial environmental influences (F), and non-shared environmental effects (E). See Table 1 for definitions. μ indexes primary phenotypic assortment (i.e., assortative mating) between the twin parents, and w indexes the covariance between A and F. Paths are squared to estimate the proportion of variance accounted for. D, S, and F effects cannot be estimated simultaneously (only two of the three can be estimated). Reprinted with permission from Burt & Klump (2012).