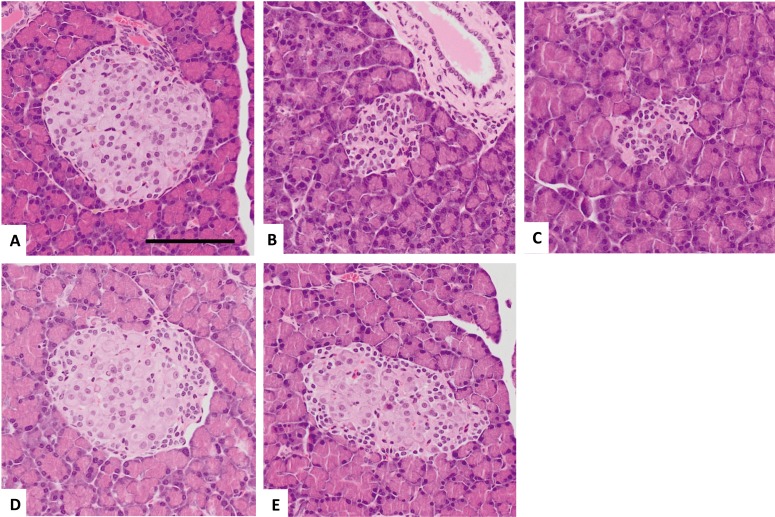
Fig. 3.
Representative images of histopathological findings in the pancreas in the control group (A), diabetic untreated group (B), dapagliflozin (0.1 mg/kg)-treated group (C), high-dose insulin (3–5 U/rat) group (D), combined treatment of insulin (1.5–2.5 U/rat) and dapagliflozin (0.1 mg/kg) (E). (A) A normal islet of Langerhans. (B, C) An atrophic islet of Langerhans. (D, E) A normal-sized islet of Langerhans. Note the swollen cells in the center and small, densely packed cells in the periphery. H&E stain. Scale bar=100 µm.

