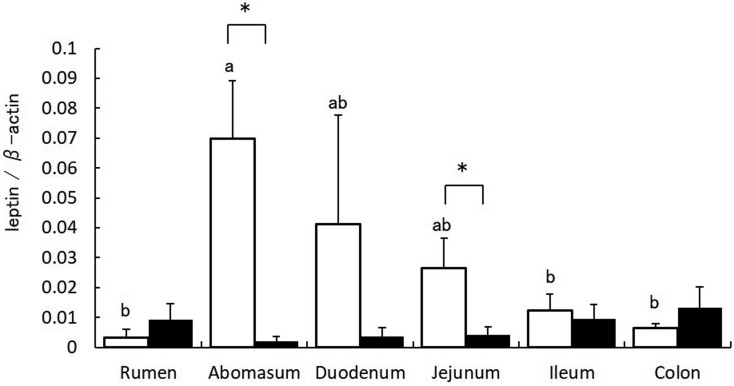
Fig. 3.
Densitometric analysis of leptin protein in the gastrointestinal tract of calves (white bar) and cows (black bar). Leptin expression relative to that of β-actin is represented as mean ± SEM for each region of the gastrointestinal tract. Values without common letters (ab) are significantly different (P<0.05, Bonferroni test). * indicates P<0.05 (t-test).

