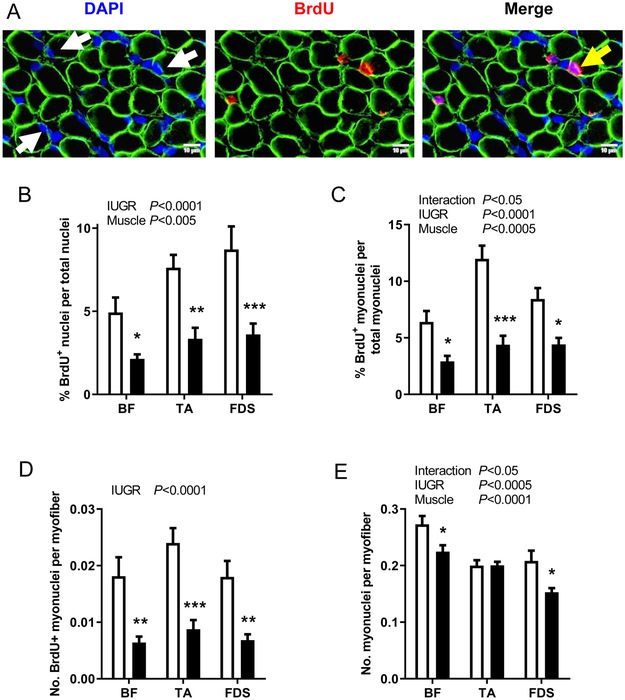
Figure 2. BrdU immunostaining.
(A) Representative sections of biceps femoris (BF) muscle showing myofiber plasma membrane (anti-dystrophin, green), nuclei (DAPI, blue), and BrdU+ nuclei (anti-BrdU, red). Myonuclei within the confines of the myofiber and BrdU+ myonuclei are identified by white and yellow arrows, respectively. Results are shown for (B) BrdU labeling index, (C) percent of BrdU+ myonuclei per total myonuclei, (D) number of BrdU+ myonuclei per myofiber cross-section, and (E) myonuclei per myofiber cross-section in BF, tibialis anterior (TA), and flexor digitorum superficialis (FDS) muscles from CON (white bar, n=8) and IUGR (black bar, n=12) fetuses. Values represent mean ± SEM. Two-way ANOVA results are shown; *P<0.05, **P<0.005, ***P<0.0005 by Bonferroni post-test comparisons.

