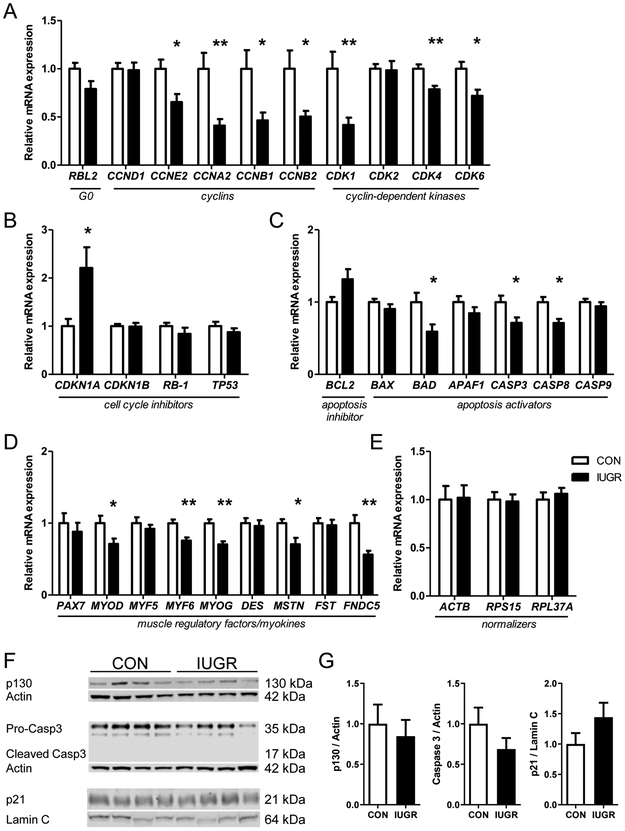
Figure 5. Fetal skeletal muscle mRNA and protein expression.
mRNA expression of (A) cell cycle regulators, (B) cell cycle inhibitors, (C) apoptosis regulators, (D) muscle regulatory factors, (E) normalizers; and (F) representative Western blots and densitometry analysis of protein expression p130, caspase 3, and nuclear p21 from CON (white bar, n=8) and IUGR (black bar, n=13) fetal biceps femoris muscle. Values represent mean ± SEM. *P<0.05, **P<0.005 by Student’s t-test.

