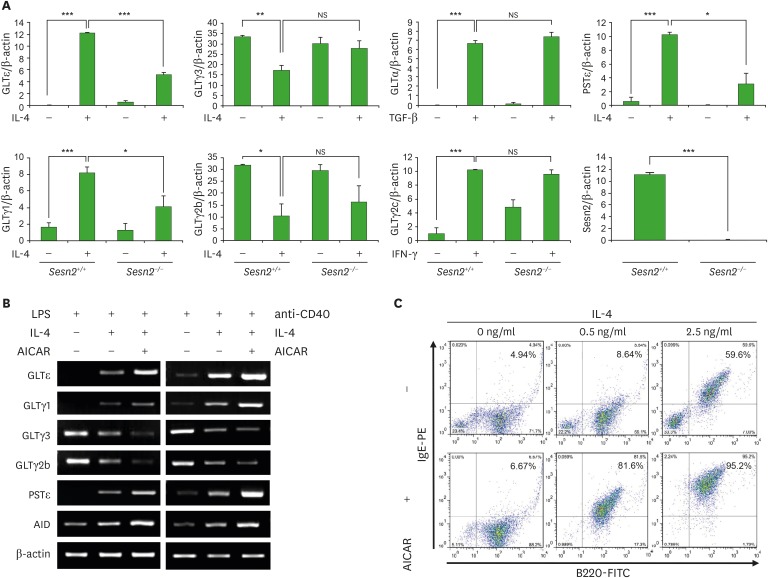
Figure 1. Effects of Sesn2 and AMPK on Ig class switching. (A) Splenocytes (1 × 10⁶ cells/ml) from Sesn2+/+ or Sesn2−/− mice were stimulated with TGF-β1 (0.2 ng/ml), IL-4 (0.5 ng/ml), and IFN-γ (10 ng/ml) in the presence of LPS (12.5 µg/ml). After 2.5 days of culture, RNAs were isolated and the levels of GLTs and PSTε were measured by RT-PCR. Graphs indicate relative cDNA levels normalized to β-actin cDNA expression using ImageJ (National Institutes of Health, Bethesda, MD, USA) analysis. (B, C) Splenocytes were stimulated with IL-4 (0.5 or 2.5 ng/ml), and AICAR (200 µM) in the presence of LPS (12.5 µg/ml) or anti-CD40 (2 µg/ml). After 2.5 days of culture, RNAs were isolated and the levels of GLTs and AID mRNA were measured by RT-PCR (B). After 4 days of culture, cells were stained with anti-IgE-PE and anti-B220-FITC, and surface Ig expression was analyzed by flow cytometry (C). Data presented are the means±SEM from three independent experiments.
NS, not significant.
*p<0.05, **p<0.01, ***p<0.001.

