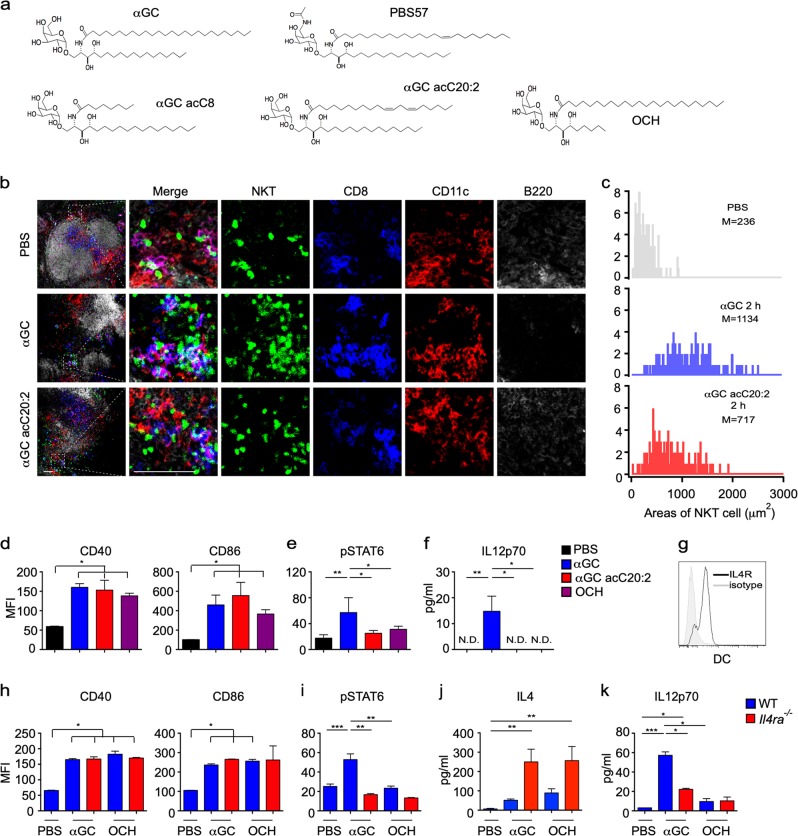
Fig. 1.
α-Galactosylceramide (αGC), not T-helper type 2 (Th2) lipid antigens, activates the IL4 receptor-signal transducer and activator of transcription 6 (IL4R-STAT6) pathway in dendritic cells (DCs.) a Structures of lipid antigen variants. b In vivo colocalization of invariant natural killer T (iNKT) cells and DCs in the spleen of Vα14 Tg. Cxcr6gfp/+ mice 2 h after injecting αGC or αGC acC20:2 (2 μg per mouse, intraperitoneally (i.p.)). Blue, CD8; red, CD11c; gray, B220; and green, iNKT. Scale bars, 50 μm. Data are representative of three independent experiments. c Distribution of the total area occupied by iNKT cells in each 100 μm × 100 μm DC zone (n ≥ 160 zones per group). Data are pooled from three independent experiments. M indicates the mean area value. d–f Expression of CD40 and CD86 (d) and phosphorylation of STAT6 (e) in splenic CD11c+ DCs and production of IL12p70 in the serum (f) of wild-type (WT) mice 8 h after receiving the indicated lipid antigens. Data are presented as the mean ± SEM of five to six mice per group. g Expression of IL4Rα in splenic CD11c+ DCs. Data are representative of five independent experiments. h–k Expression of CD40 and CD86 (h) and phosphorylation of STAT6 (i) in splenic CD11c+ DCs and serum production of IL4 (j) and IL12p70 (k) in WT or Il4a−/− mice 8 h after receiving the indicated lipid antigens. Data are presented as the mean ± SEM of five to six mice per group. Statistical analysis was performed using one-way analysis of variance (ANOVA) with the Tukey’s post test. *P < 0.05; **P < 0.01; and ***P < 0.001

