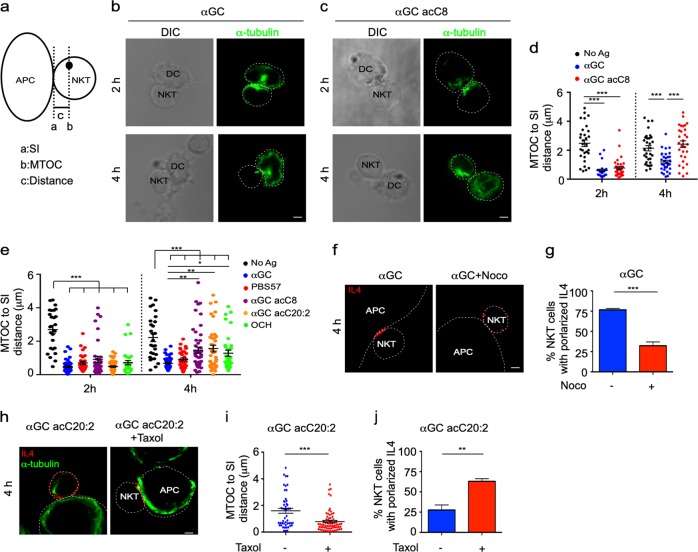
Fig. 4.
Microtubule-organizing center (MTOC) controls polarized secretion of interleukin-4 (IL4). a Method to quantify the distance from the MTOC to the synaptic interface (SI). b, c Polarization of the MTOC in invariant natural killer T (iNKT) cells activated by distinct antigen variant-pulsed splenic dendritic cells (DCs) at the indicated time points. Scale bars, 2 μm. Data are representative of three independent experiments and more than 60 cells per group. d Distance from the MTOC to the SI in the iNKT cells described in b, c. Data are presented as the mean ± SEM of more than 40 cells per group. e Distance from the MTOC to the SI in iNKT cells activated by distinct antigen variant-pulsed RBL.CD1d cells at the indicated time points. Data are presented as the mean ± SEM of more than 60 cells per group. f, g Influences of nocodazole (33 μM) on IL4 secretory sites (f) and the frequency of iNKT cells with polarized secretion (g) after activation by α-galactosylceramide (αGC)-pulsed RBL.CD1d cells for 4 h. Scale bars, 2 μm. Data are representative of three independent experiments (f) or are presented as the mean ± SEM of three independent experiments (g). h–j Influences of taxol (100 nM) on the distance from the MTOC to the SI (h, i) and on IL4 polarization (h, j) in iNKT cells activated by αGC acC20:2-pulsed RBL.CD1d cells for 4 h. Scale bars, 2 μm. Data are representative of three independent experiments (h), are presented as the mean ± SEM of (j) three independent experiments or are presented as the mean ± SEM of more than 60 cells per group (i). Dotted lines indicate cell boundaries. Statistical analysis was performed using one-way analysis of variance (ANOVA) with the Tukey’s post test or using Student’s t test. *P < 0.05; **P < 0.01; and ***P < 0.001

