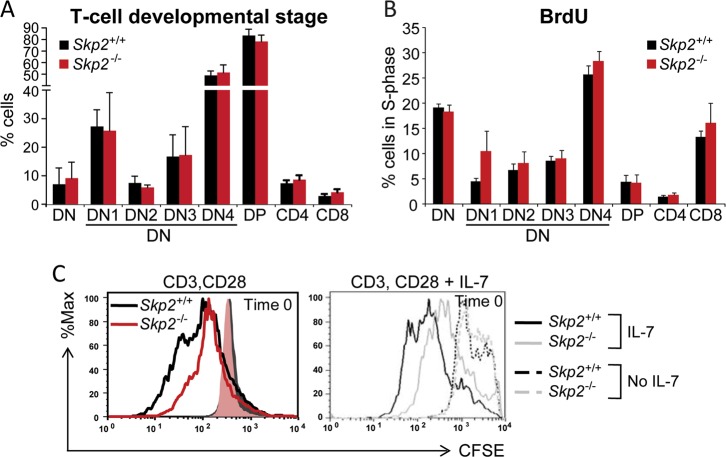
Fig. 1.
Impact of SKP2 depletion on normal lymphopoiesis. a Flow cytometry analysis of thymic subsets in Skp2+/+ and Skp2−/− mice. Percentage of DN, DP, CD4-SP, and CD8-SP cells within the whole thymus and of DN1-4 within the DN subpopulation; n = 6 (Skp2−/−) and n = 9 (Skp2+/+) in three independent experiments. b Percentage of cells in S-phase measured by BrdU incorporation in indicated T-cell subsets in Skp2+/+ and Skp2−/− thymocytes; n = 4 (Skp2−/−) and n = 7 (Skp2+/+) in two independent experiments. c Naive T-cells from Skp2+/+ and Skp2−/− mice stained with CFSE (10 µM) were activated with anti-CD3 (2 µg/mL) and anti-CD28 (0.5 µg/mL) for 2 days (left panel). On day 3, an equal number of cells were CFSE stained and further treated for 72 h with 5 ng/ml of IL-7 (right panel). Black and red or gray lines show CFSE dilution in the Skp2+/+ and Skp2−/− T-cells, respectively. Solid or dashed histograms show equal loading/Time 0 of the CFSE dye (representative experiment, n = 3). In bar graphs, results are shown as average ± SD

