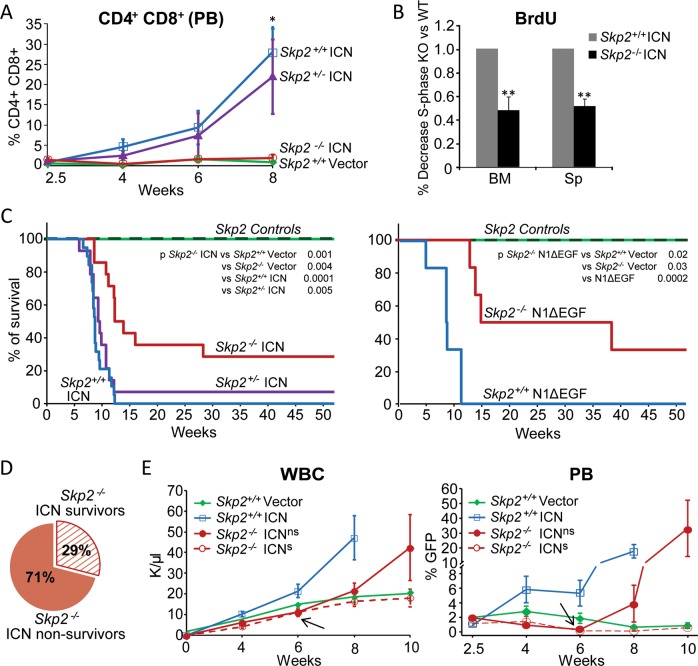
Fig. 4.
Loss of SKP2 attenuates Notch-induced leukemia. Lin− cells from Skp2+/+, Skp2+/−, or Skp2−/− (CD45.2) mice were transduced with MSCV-GFP (Vector), MSCV-ICN1-GFP (ICN), or MSCV-N1ΔEGFΔLNRΔP-GFP (N1ΔEGF) constructs. 2.5 × 10⁴ GFP+ cells were transplanted into lethally irradiated BoyJ (CD45.1) recipients (three independent experiments) and were analyzed for: a Percentage of DP T-cells in in gated CD45.2+ donor cells in PB. Skp2+/+ Vector (n = 6), Skp2+/+ ICN (n = 10), Skp2+/− ICN (n = 10) and Skp2−/− ICN (n = 6); (average ± SE). b Bar graph show BrdU incorporation in GFP+ cells from Skp2+/+ ICN (n = 5) and Skp2−/− ICN (n = 3) in BM and spleen populations analyzed in recipients at week 8 from transplant. c Kaplan–Meier survival curve. Control cohorts include: Skp2+/+ Vector group (n = 10; green solid line) and Skp2−/− nontransduced and Skp2−/− Vector group (n = 8; dark green dashed line); all these groups behaved identically. Experimental cohorts: in left panel include Skp2+/+ ICN (n = 19; blue line), Skp2−/+ ICN (n = 14; purple line) and Skp2−/− ICN (n = 14; red line); in right panel includes Skp2+/+ N1ΔEGF (n = 6; blue line) and for Skp2−/− N1ΔEGF (n = 6; red line). d Scheme representing the survival percentages of Skp2−/− ICNns (solid red) and Skp2−/− ICNs (dashed red). Mice within Skp2−/− ICN genotype were distributed in two groups based on their survival, here called Skp2−/− ICNns (no survivors; 71%) and Skp2−/− ICNs (survivors; 29%). Recipients of all genotypes (in three independent experiments), were analyzed at full-blown disease or at 1 year from transplant. e Line graph in left panel represents counts of WBC in the PB of recipient mice at the time points indicated. Line graph in right panel represents percentage of GFP+ cells gated on CD45.2+ cells in the PB of recipient mice at the time points indicated (average ± SE). Skp2+/+ Vector (n = 6), Skp2+/+ ICN (n = 10), Skp2−/− ICNns (n = 6), and Skp2−/− ICNs (n = 3). Arrows indicates point of divergence between Skp2−/− ICNs and Skp2−/− ICNns. All results are expressed as average ± SD unless otherwise indicated. *p < 0.05, **p < 0.01, ***p < 0.005 by two-sample t-test, t-test or log-rank test

