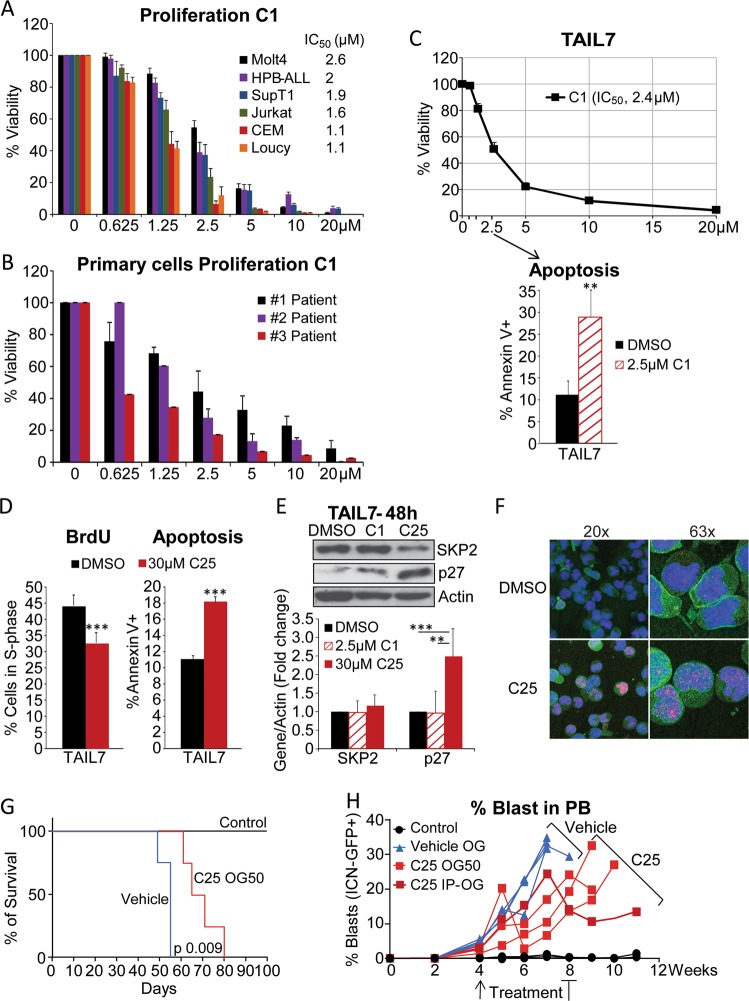
Fig. 6.
SKP2 blockade by small molecule inhibitors reduces proliferation of T-ALL in cell lines, primary cells, and in vivo in a xenograft model of T-ALL. Viability assays for the C1 inhibitor were performed at 96 h for cell lines and 48 h for primary cells. DMSO was used as vehicle control in all experiments. a Percentage viability of human T-ALL cell lines treated with increasing doses of the SKP2 inhibitor C1 (average ± SE). SupT1, HBP-ALL (n = 4), and all other cell lines (n = 6) in three independent experiments. b Percentage viability of primary T-ALL patient cells treated with increasing doses of the SKP2 inhibitor C1 (three patients samples, two independent experiment). c Top panel: percentage viability of TAIL7 cells treated with increasing doses of the SKP2 inhibitor C1 (n = 6 in three independent experiments). Bottom panel: percentage of cells in S-phase measured by BrdU incorporation and percentage of apoptotic cells measured by Annexin V in TAIL7 cells treated for 48 h with 2.5 µM C1 or DMSO; n = 4. d Percentage of cells in S-phase measured by BrdU incorporation and percentage of apoptotic cells measured by Annexin V in TAIL7 cells treated for 48 h with 30 µM C25 or DMSO as vehicle control (average ± SD); n = 3. e Western blot (top) and densitometry analysis (bottom) of SKP2, p27Kip1, and β-Actin protein levels in TAIL7 cells treated with DMSO, 2.5 µM C1 and 30 µM C25 for 48 h; four independent experiments. f Immunofluorescence images show accumulation and localization of p27kip1 (red) in the nucleus (blue) in TAIL7 cells following treatment with 30 µM of C25 or DMSO for 48 h (representative of three independent experiments). g Line graph shows average percentage of ICN-GFP+ blasts in the PB of each recipient mouse at the time points indicated. End point is the last point indicated in the graph. h Kaplan–Meier survival curve. All experiments are shown as average ± SD unless otherwise indicated. **p < 0.01, ***p < 0.005 by t-test. p = 0.009 by long rank test

