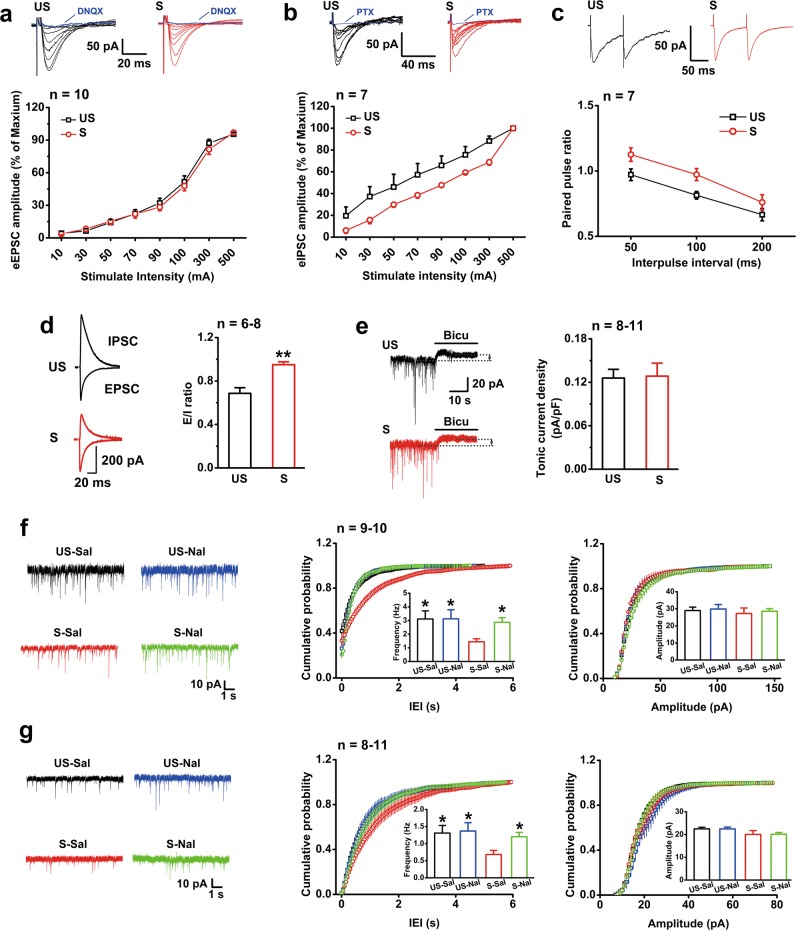
Fig. 3.
EP stress attenuates inhibitory synaptic transmission on CA1 pyramidal neurons. The number of cells labelled is equal to the number of animals used. a Stress does not alter the I/O curves of eEPSCs. The eEPSC was abolished by DNQX (20 μM). Group F1,17 = 0.558, p = 0.465; group×intensity F9,153 = 1.15, p = 0.332; RM ANOVA. b I/O curves of eIPSCs show a significant difference between the unstressed and stressed mice. The eIPSC was abolished by PTX (100 μM). Group F1,12 = 4.94, p = 0.046; group×intensity F7,84 = 1.55, p = 0.163; RM ANOVA. c PPR of eIPSCs at different interpulse intervals. Group F1,12 = 9.78, p = 0.009; group×interval F2,24 = 0.34, p = 0.717; RM ANOVA. d The E/I ratio is increased in the stressed mice. e The tonic inhibitory currents of CA1 individual pyramidal neurons in slices from the unstressed and stressed mice are assessed by application of bicuculline. Stress does not affect the density of tonic inhibitory current. f EP stress depresses sIPSCs in CA1 pyramidal neurons, and this effect is reversed by naloxone administration. p < 0.05 for cumulative probability of IEIs (S-Sal vs. US-Sal, US-Nal or S-Nal) and p > 0.05 for cumulative probability of amplitude, K-S test. Mean values of frequency F3,35 = 4.46, p = 0.021; and mean values of amplitude F3,35 = 0.19, p = 0.903; one-way ANOVA; *, vs. S-Sal. g EP stress depresses mIPSCs in CA1 pyramidal neurons, and this effect is reversed by naloxone administration. p < 0.05 for probability of IEIs (S-Sal vs. US-Sal, US-Nal or S-Nal) and p > 0.05 for probability of amplitude, K-S test. Frequency F3,33 = 2.93, p = 0.048; amplitude F2,26 = 1.72, p = 0.181; one-way ANOVA; *, vs. S-Sal. One symbol, p < 0.05; two symbols, p < 0.01. US unstressed, S stressed, Bicu bicuculline, Sal saline, Nal naloxone

