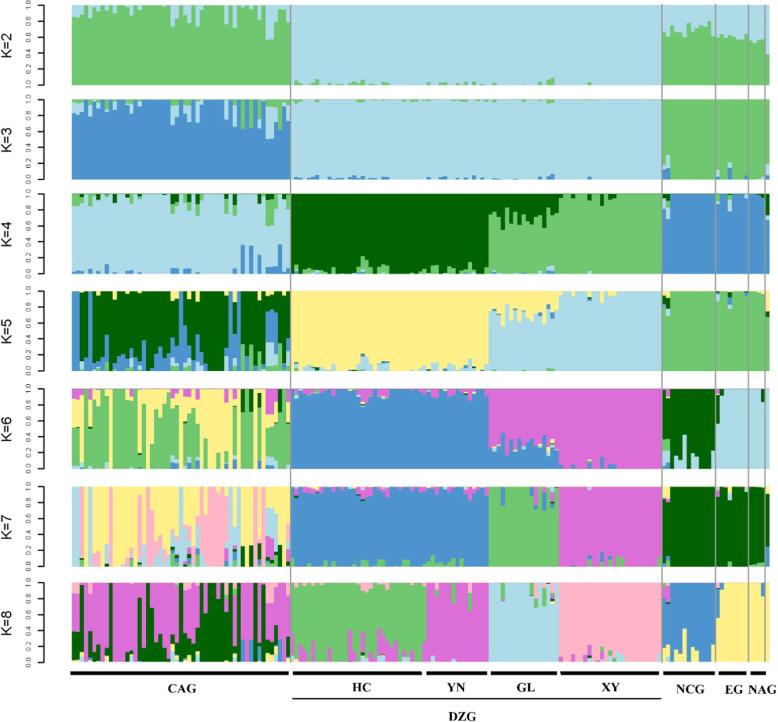
Fig. 3. Population structure of 168 accessions of Prunus spp.
Each column represents an individual, with the length of the different color segments representing the proportion of an ancestor in the individual’s genome. K = 2–8 indicates the number of ancestral groups assumed in this study from 2 to 8; The x-coordinate indicates the name of the sample, and the order of the sample of the same group was specified together. HC Huocheng county, YN Yining county, GL Gongliu county, XY Xinyuan county

