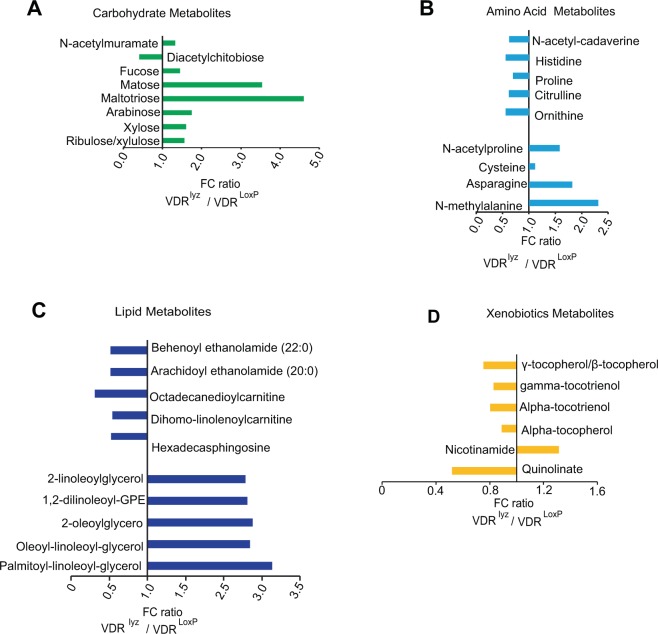
Figure 2.
Overall alteration in the metabolites following myeloid cell-specific VDR deletion: Fold change ratio generated by (A) carbohydrate (B) amino acids (C) lipid and (D) xenobiotics metabolism in VDR∆lyz mice. The graph represents only those biochemicals showing maximum alterations among known detectable metabolites. Differences are assessed by the Mann–Whitney U test. VDR∆lyz (N = 10) & VDRLoxP (N = 16). Significance is established at adjusted 0.05 < P < 0.1.

