
Figure 6.
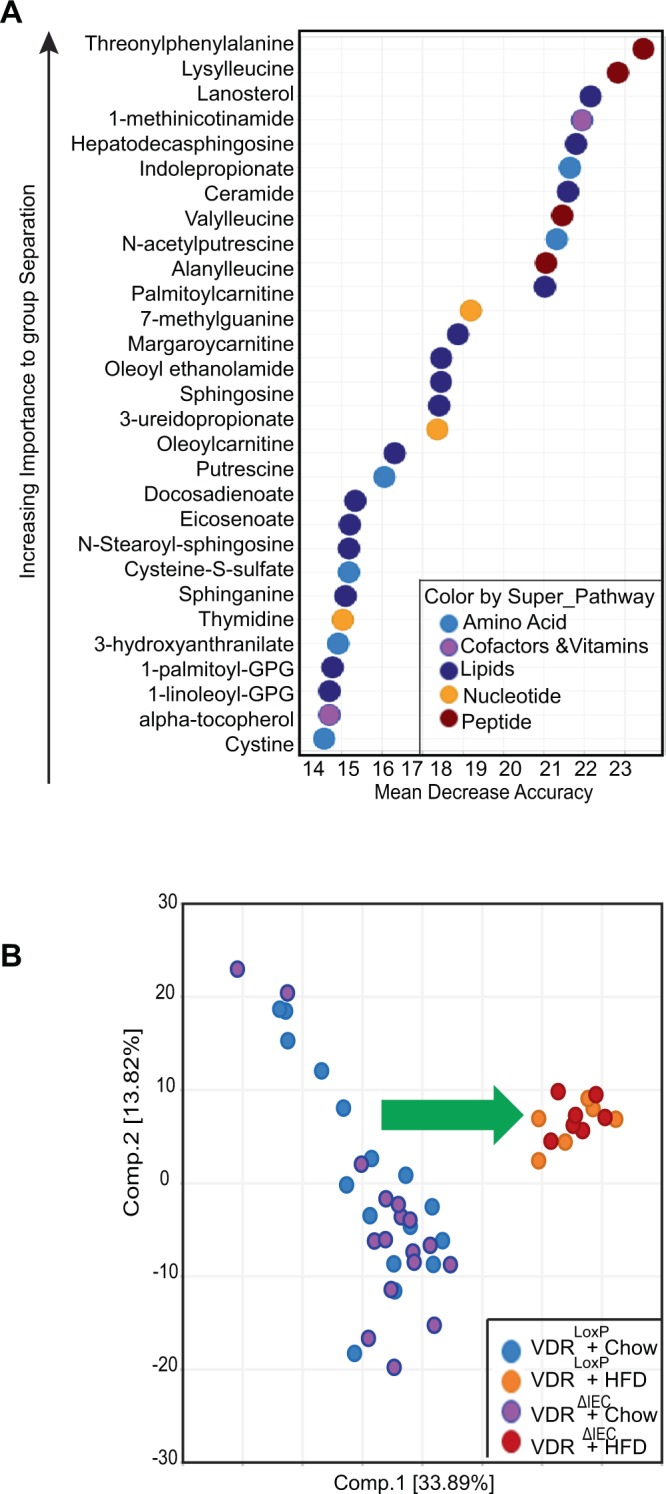
Alteration in the metabolites following VDR Deletion and HFD intervention: (A) Random forest (RF) analysis showing the top 30 metabolites responsible for classification as mean decrease accuracy values. Most vital biochemicals are listed from data derived from fecal samples of VDRLoxP, VDR∆IEC mice fed with HFD or chow diet. Different colors indicate different biochemicals like, light blue = amino acid, purple = co-factors &vitamins, blue = lipids, orange = nucleotide, red = peptide. (B) Principal Component Analysis (PCA) on metabolite level Correlations. Color code: light blue= VDRLoxP + chow, orange = VDRLoxP + HFD, purple= VDR∆IEC chow, red = VDR∆IEC + HFD. VDRΔIEC group (Chow diet: N = 17; HFD: N = 7), & VDRLoxP (Chow Diet: N = 16; HFD: N = 6).