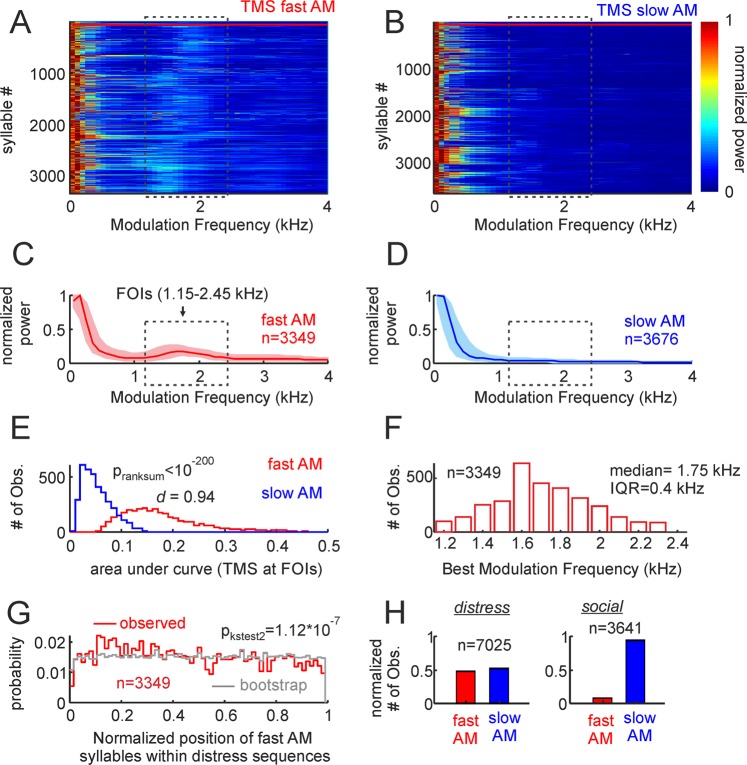
Figure 2.
Temporal properties of fast and slow amplitude modulated (AM) vocalizations. (A,B) Show the TMS of the two syllable groups, represented as colormaps. The first 50 fast AM and slow AM calls in the colormaps (border marked by horizonal red lines) were used to train the support vector machine classifier (see also supplementary Figure S1). (C,D) Are median TMS of all fast and slow AM calls studied (25th and 75th percentiles shown as shaded areas). Note that a peak occurs at the frequencies of interest (FOIs) in fast AM calls but not in slow AM vocalizations. (E) Histogram of the area under the TMS curve at the FOIs in the two call groups. The p-value of a Wilcoxon ranksum test and the d size-effect metric are provided. (F) histogram of best modulation frequencies found in the population of fast AM calls. Median and inter-quartile range are provided. (G) Probability of finding fast AM vocalizations in certain positions along the distress sequences. To calculate probability values, the relative position of each fast AM call was obtained taking into account the length of the sequence in which it occurred. This “observed” probability distribution was compared (Kolmogorov-Smirnov two-sample test) with an “expected” distribution obtained by randomly swapping the position of syllables within each sequence 100 times. (H) The percentage of fast and slow AM calls found when bats where under duress (distress) and when interacting between them in a keeping cage (social, see also Supplementary Fig. S3).

