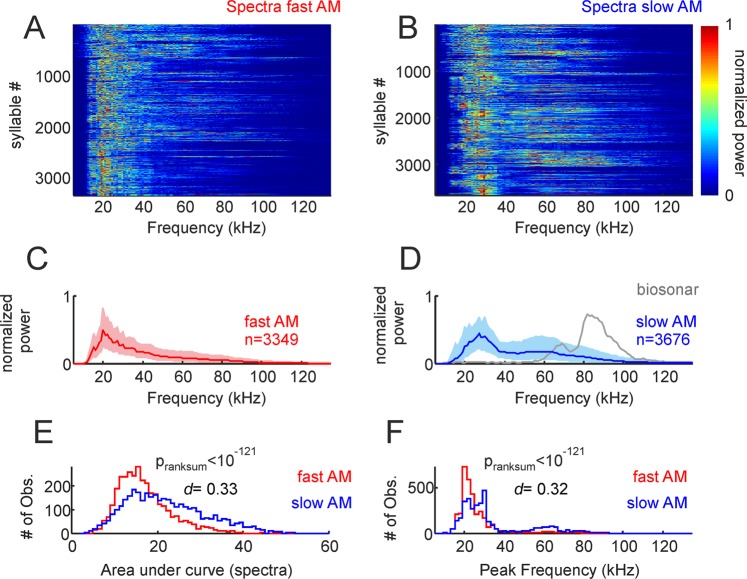
Figure 3.
Spectral properties of fast and slow amplitude modulated (AM) vocalizations. (A and B) Show the spectra of the two syllable groups, represented as colormaps. (C and D) Are median spectra of all fast and slow AM calls studied (25th and 75th percentiles shown as shaded areas). The median spectrum of 100 biosonar calls is shown in D for comparison purposes. (E) Histogram of area under curve calculated from the spectra of fast and slow AM vocalizations. The p-value of a Wilcoxon ranksum test and the d size-effect metric are provided. (F) Histogram of peak frequency in fast and slow AM calls.

