Figure 4.

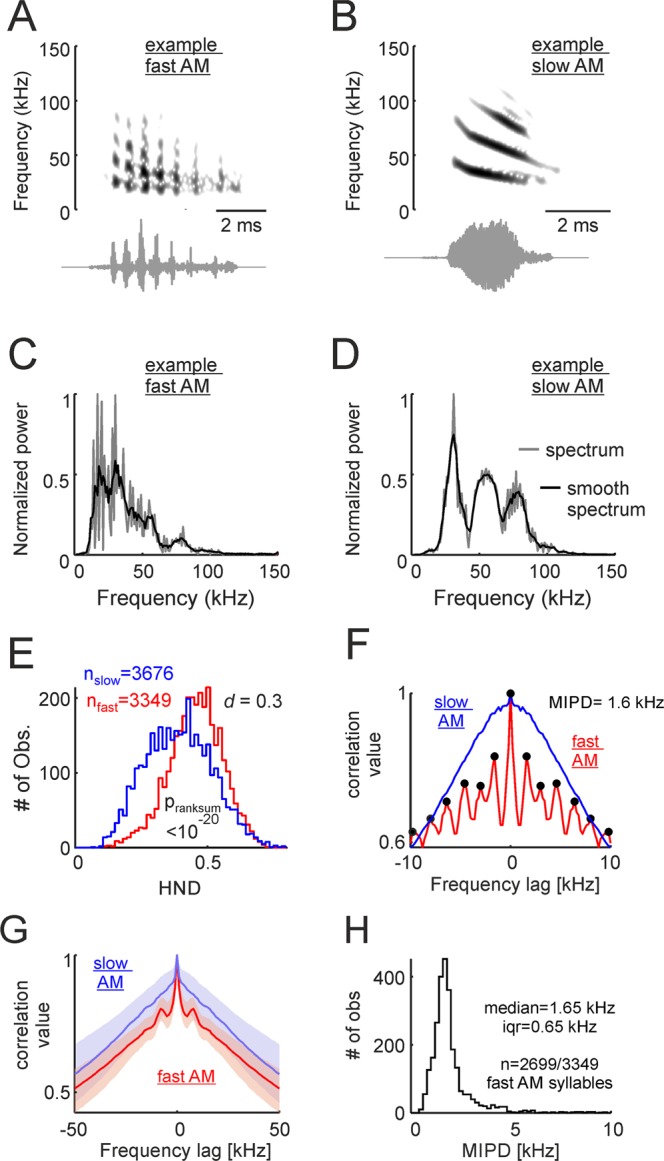
Spectral regularities are a characteristic feature of fast amplitude modulated vocalizations (fAMVs). (A and B) Show the spectrograms and waveforms of one example fAMV and one slow modulated vocalization (sAMV, A and B, respectively). (C and D) Are the spectra of the same two example vocalizations. Note that the observed spectra (200-Hz frequency resolution) and “smooth” spectra are represented. Smooth spectra were calculated using a 5-point moving average. The difference between the observed and the smooth-spectra was used for harmonic-to-noise difference (HND) calculations. (E) Histograms of HND for fAMVs and sAMVs. The p-value of a Wilcoxon ranksum test and the d size-effect metric are provided. (F) Spectral autocorrelograms for the example fAMV and sAMV shown in (C and D). Note that spectral regularities (i.e. peaks spaced at regular distances) occurred in the example fAMV. In this example, the median inter-peak distance (MPID) was 1.6 kHz. (G) Median spectral autocorrelograms for all fAMVs and sAMVs studied (25th and 75th percentiles shown as shaded areas). Note the side- peaks occurring in the population of fAMVs. (H) Histogram of MPID for the fAMVs in which more than one peak could be detected in the spectral autocorrelogram. Median and interquartile range are (iqr) given.
