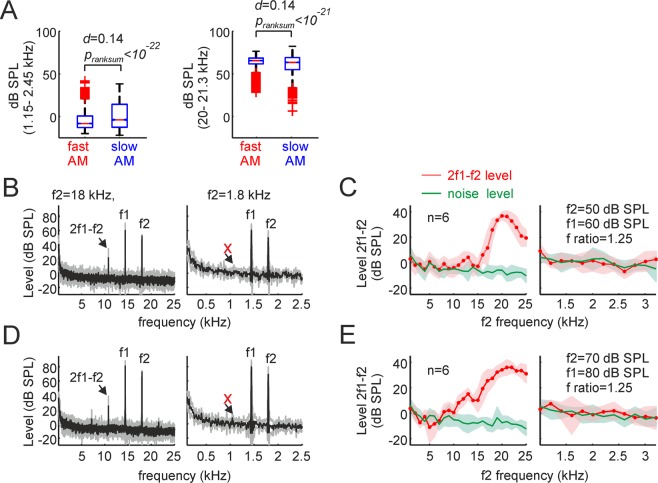
Figure 5.
1.7 kHz is has low power as carrier frequency and does not trigger responses in the bat cochlea. (A, left) Sound pressure level (in dB SPL) calculated in the range from 1.1–2.5 kHz. Note that this frequency range was not well represented in the sounds uttered, i.e. values were always below 50 dB SPL in fast modulated and slow modulated vocalizations, and median SPLs were close to 0. The p-value of a Wilcoxon ranksum test and the d size-effect metric are provided. The same analysis is shown in the right panel of A for the frequency range between 20–21.3 kHz for comparison purposes. On each box, the central mark indicates the median, and the bottom and top edges of the box indicate the 25th and 75th percentiles, respectively. The whiskers extend to the most extreme data points not considered outliers, and the outliers are plotted individually using the ‘+’ symbol. (B) Average distortion product (DP) measurements obtained in six animals for f2 frequencies of 18 kHz and 1.8 kHz (left and right, respectively), when the f2 level was set to 50 dB SPL. Note that a strong cubic DP (2f2-f1) appeared when f2 was equal to18 kHz, but not when it was 1.8 kHz. (C) Coarse and high-resolution DPgrams obtained with frequency steps of 1 kHz and 200 Hz (left and right, respectively). Coarse DPgrams covered f2 frequencies from 1–25 kHz, while high-resolution DPgrams covered f2 frequencies from 1- 3.2 kHz. In high-resolution DPgrams, the DP level measured remained within the acoustic noise level, thus indicating poor hearing sensitivity for those frequencies. (D,E) Show DP measurements similar to those depicted in B and C, but for stimulus levels of 80/70 dB SPL.

