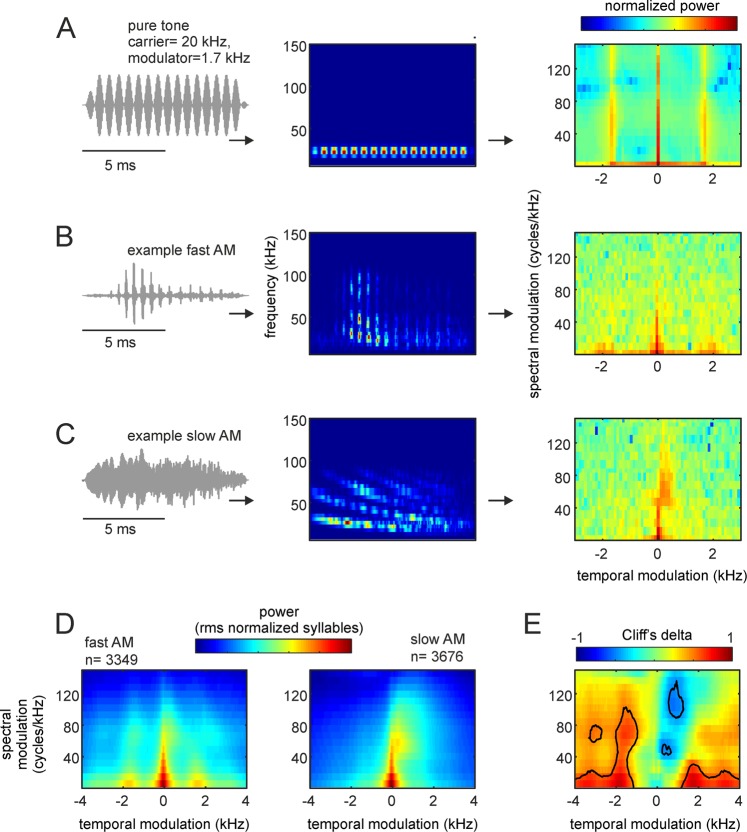
Figure 6.
Modulation power spectra (MPS) of bat distress vocalizations. (A, from left to right) The waveform, spectrogram, and MPS of a pure tone temporally modulated at 1.7 kHz. Note that the temporal modulation appears in the MPS as side-peaks at −1.7 and 1.7 kHz. (B,C) show the waveform, spectrogram, and MPS for an example fast and one slow amplitude modulated (AM) vocalization, respectively. Note that fast temporal modulations are visible in the modulation power spectrum of the example fast AM vocalization. (D) Average MPS for the population of fast and slow AM calls studied. (E) Cliff’s delta (d) obtained after comparing the MPS of the syllable groups. Contour lines indicate large size-effects (i.e. d > 0.478), indicating consistent MPS differences.

