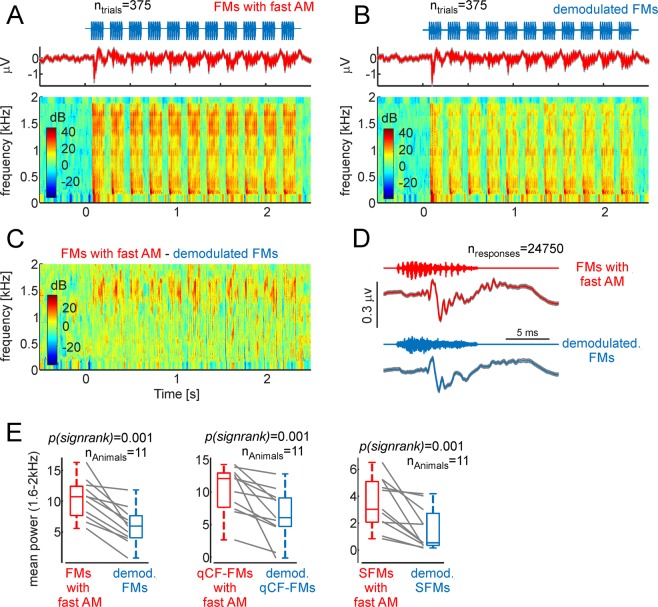
Figure 9.
Fast amplitude modulated (AM) vocalizations trigger frequency following responses in the bat brain. (A) Average neural responses to a sequence of fast-AM FM syllables across all trials and animals (n = 11) studied. Responses are represented as voltage vs. time and in the form of neural spectrograms. (B) Same as panel A, but in response to the sequence of demodulated FMs. Note that at frequencies ~1.7 kHz, more power occurred in response to fast-AM than to demodulated FMs. (C) Difference between the neural spectrograms depicted in (A,B). (D) Voltage fluctuations obtained after averaging neural responses to each fast-AM FM (red) and each demodulated FM syllable (blue) across trials and animals. Note that responses to fast-AM FMs carried faster modulations than those obtained in response to demodulated FMs. (E) Mean power in the range from 1.6–2 kHz across animals and sequences studied. In each animal, fast AM syllables rendered higher power than their demodulated treatment.

