Figure 4.
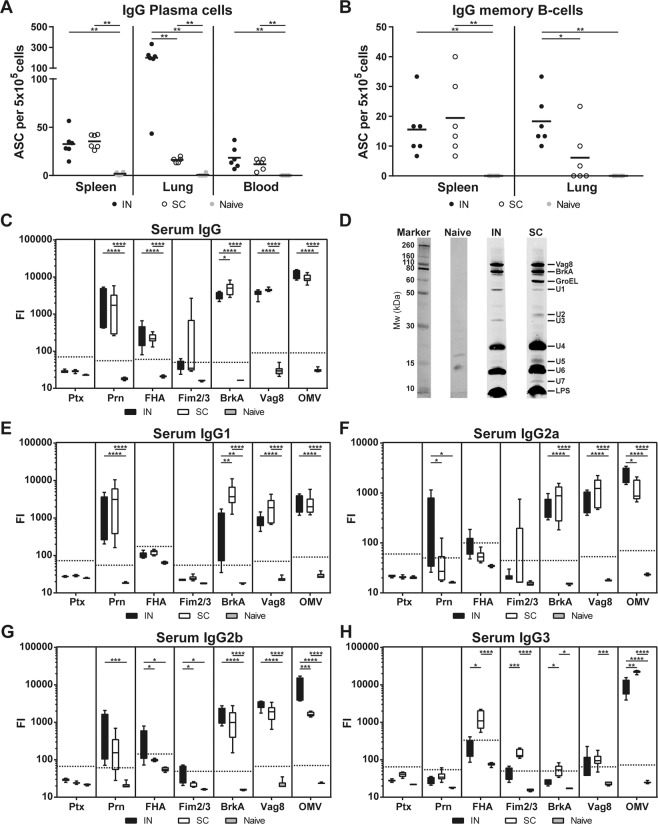
Systemic humoral responses. (A) Numbers of OMV-specific IgG-secreting plasma cells in spleens, lungs and blood and (B) numbers of IgG memory cells in spleens and lungs were determined by B-cell ELISpot of 6 mice per group at day 35 and day 56, respectively. Results are indicated as antibody-secreting cells (ASC) per 5 × 10⁵ cells. (C–H) Levels of (C) immunoglobulin G (IgG) antibodies and (E–H) IgG subclasses 1, 2a, 2b and 3 antibodies directed against Ptx, Prn, FHA, Fim2/3, BrkA, Vag8 and OMV were determined in serum of 6 mice per group. Results are expressed as fluorescence intensities (FI). (D) Western blot for antibody profiling with pooled (n = 6) serum IgG using B. pertussis B1917 lysate as antigen. The same scan intensity was applied to all blots. In the box plots, the box represent 25th to 75th percentiles, whereas the bars indicate the minimum and maximum value. Horizontal dashed lines represent the limit of detection (background x 3). Significant differences are indicated by *p < 0.05, **p < 0.01, ***p < 0.001, ****p < 0.0001 obtained using a Mann-Whitney t-test (B-cells) and t-test (antibodies) after log-transformation of data.

