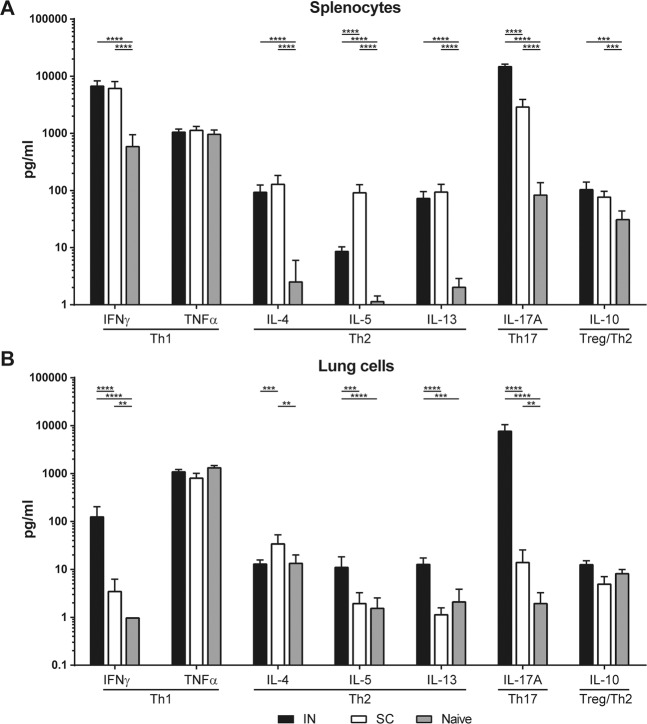
Figure 5.
T-helper cytokine profiles in splenocytes and lung cells. Concentrations of T-helper 1, 2 and 17-related cytokines were determined in supernatant after 3-day stimulation with OMV of (A) splenocytes and (B) lung cells. Results in pg/mL are corrected for the background level (IMDM complete medium control) and are given as mean±s.d. of 6 mice per group. Significant differences (≥2x alteration compared to naive group) are indicated by *p < 0.05, **p < 0.01, ***p < 0.001, ****p < 0.0001 obtained using a t-test after log-transformation of data.

