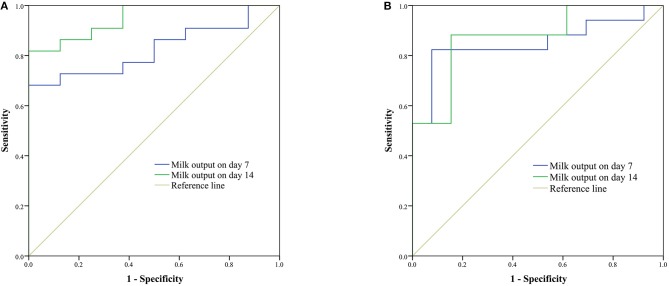
Figure 4.
Receiver operating characteristic (ROC) curves of milk output on days 7 and 14 for prediction of milk output > 750 g/d (A) and > 1,000 g/d (B) on day 42. (A) For the cut-off values of 406.8 g/d on day 7 [the area under the curve (AUC) was 0.824; 95% CI was 0.678–0.970; P = 0.008; sensitivity was 68.2%; specificity was 100%] and 518.0 g/d on day 14 (AUC was 0.949; 95% CI was 0.875–1.000; P < 0.001; sensitivity was 81.8%; specificity was 100%) were selected to predict the milk output being more than 750 g/d on day 42. (B) For the cut-off values of 406.8 g/d on day 7 (AUC was 0.851; 95% CI was 0.705–0.996; P = 0.001; sensitivity was 82.4%; specificity was 94.3%) and 600.9 g/d on day 14 (AUC was 0.873; 95% CI was 0.745–1.000; P = 0.001; sensitivity was 88.2%; specificity was 84.6%) were selected to predict the milk output being more than 1,000 g/d on day 42.

