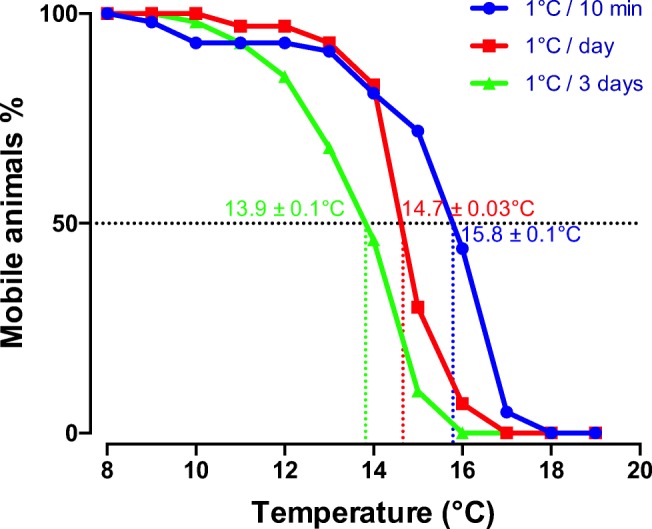
Fig. 2.

Curves representing the loss of mobility of a population of krill subjected to gradual temperature increase (0.1 °C/min, blue curve, n = 43; 1 °C/day, red curve, n = 30; 1 °C/3 days, green curve, n = 30). CTmax is the temperature at which 50% of mobile animals are reached
